Lenovo 2010 Annual Report Download - page 150
Download and view the complete annual report
Please find page 150 of the 2010 Lenovo annual report below. You can navigate through the pages in the report by either clicking on the pages listed below, or by using the keyword search tool below to find specific information within the annual report.-
 1
1 -
2
-
3
-
4
-
5
-
6
-
7
-
8
-
9
-
10
-
11
-
12
-
13
-
14
-
15
-
16
-
17
-
18
-
19
-
20
-
21
-
22
-
23
-
24
-
25
-
26
-
27
-
28
-
29
-
30
-
31
-
32
-
33
-
34
-
35
-
36
-
37
-
38
-
39
-
40
-
41
-
42
-
43
-
44
-
45
-
46
-
47
-
48
-
49
-
50
-
51
-
52
-
53
-
54
-
55
-
56
-
57
-
58
-
59
-
60
-
61
-
62
-
63
-
64
-
65
-
66
-
67
-
68
-
69
-
70
-
71
-
72
-
73
-
74
-
75
-
76
-
77
-
78
-
79
-
80
-
81
-
82
-
83
-
84
-
85
-
86
-
87
-
88
-
89
-
90
-
91
-
92
-
93
-
94
-
95
-
96
-
97
-
98
-
99
-
100
-
101
-
102
-
103
-
104
-
105
-
106
-
107
-
108
-
109
-
110
-
111
-
112
-
113
-
114
-
115
-
116
-
117
-
118
-
119
-
120
-
121
-
122
-
123
-
124
-
125
-
126
-
127
-
128
-
129
-
130
-
131
-
132
-
133
-
134
-
135
-
136
-
137
-
138
-
139
-
 140
140 -
 141
141 -
 142
142 -
 143
143 -
 144
144 -
 145
145 -
 146
146 -
 147
147 -
 148
148 -
 149
149 -
 150
150 -
 151
151 -
 152
152
 |
 |
2009/10 Annual Report Lenovo Group Limited
148
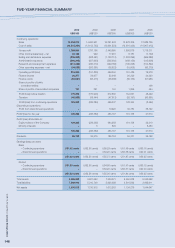
FIVE-YEAR FINANCIAL SUMMARY
2010 2009 2008 2007 2006
US$’000 US$’000 US$’000 US$’000 US$’000
Continuing operations
Sales 16,604,815 14,900,931 16,351,503 13,978,309 12,685,726
Cost of sales (14,815,221) (13,103,735) (13,901,523) (12,091,433) (10,967,415)
Gross profit 1,789,594 1,797,196 2,449,980 1,886,876 1,718,311
Other income/(expenses) – net 83,126 929 17,261 8,187 (7,739)
Selling and distribution expenses (839,388) (938,451) (1,103,713) (1,033,296) (969,288)
Administrative expenses (566,245) (627,903) (595,902) (488,150) (415,608)
Research and development expenses (214,343) (220,010) (229,759) (196,225) (164,822)
Other operating expenses – net (34,058) (203,561) (38,823) (15,906) (85,275)
Operating profit/(loss) 218,686 (191,800) 499,044 161,486 75,579
Finance income 20,377 59,977 52,048 26,329 24,229
Finance costs (62,881) (56,473) (38,366) (35,133) (51,981)
Share of profits of jointly
controlled entities – – – – 138
Share of profits of associated companies 121 351 124 1,869 464
Profit/(loss) before taxation 176,303 (187,945) 512,850 154,551 48,429
Taxation (46,935) (38,444) (47,613) (26,197) (56,881)
Profit/(loss) from continuing operations 129,368 (226,389) 465,237 128,354 (8,452)
Discontinued operations
Profit from discontinued operations – – 19,920 32,784 36,122
Profit/(loss) for the year 129,368 (226,389) 485,157 161,138 27,670
Profit/(loss) attributable to:
Equity holders of the Company 129,368 (226,392) 484,263 161,138 22,210
Minority interests – 3 894 – 5,460
129,368 (226,389) 485,157 161,138 27,670
Dividends 68,728 35,575 186,753 59,331 59,198
Earnings/(loss) per share
Basic
– Continuing operations US1.42 cents (US2.56 cents) US5.29 cents US1.49 cents (US0.16 cents)
– Discontinued operations – – US0.22 cents US0.38 cents US0.41 cents
US1.42 cents (US2.56 cents) US5.51 cents US1.87 cents US0.25 cents
Diluted
– Continuing operations US1.33 cents (US2.56 cents) US4.86 cents US1.47 cents (US0.15 cents)
– Discontinued operations – – US0.20 cents US0.37 cents US0.40 cents
US1.33 cents (US2.56 cents) US5.06 cents US1.84 cents US0.25 cents
Total assets 8,955,928 6,621,663 7,539,321 5,450,838 5,040,558
Total liabilities 7,349,910 5,310,748 5,926,058 4,316,562 3,995,911
Net assets 1,606,018 1,310,915 1,613,263 1,134,276 1,044,647