Lenovo 2010 Annual Report Download - page 129
Download and view the complete annual report
Please find page 129 of the 2010 Lenovo annual report below. You can navigate through the pages in the report by either clicking on the pages listed below, or by using the keyword search tool below to find specific information within the annual report.-
 1
1 -
2
-
3
-
4
-
5
-
6
-
7
-
8
-
9
-
10
-
11
-
12
-
13
-
14
-
15
-
16
-
17
-
18
-
19
-
20
-
21
-
22
-
23
-
24
-
25
-
26
-
27
-
28
-
29
-
30
-
31
-
32
-
33
-
34
-
35
-
36
-
37
-
38
-
39
-
40
-
41
-
42
-
43
-
44
-
45
-
46
-
47
-
48
-
49
-
50
-
51
-
52
-
53
-
54
-
55
-
56
-
57
-
58
-
59
-
60
-
61
-
62
-
63
-
64
-
65
-
66
-
67
-
68
-
69
-
70
-
71
-
72
-
73
-
74
-
75
-
76
-
77
-
78
-
79
-
80
-
81
-
82
-
83
-
84
-
85
-
86
-
87
-
88
-
89
-
90
-
91
-
92
-
93
-
94
-
95
-
96
-
97
-
98
-
99
-
100
-
101
-
102
-
103
-
104
-
105
-
106
-
107
-
108
-
109
-
110
-
111
-
112
-
113
-
114
-
115
-
116
-
117
-
118
-
 119
119 -
 120
120 -
 121
121 -
 122
122 -
 123
123 -
 124
124 -
 125
125 -
 126
126 -
 127
127 -
 128
128 -
 129
129 -
 130
130 -
 131
131 -
 132
132 -
 133
133 -
 134
134 -
 135
135 -
 136
136 -
 137
137 -
 138
138 -
 139
139 -
140
-
141
-
142
-
143
-
144
-
145
-
146
-
147
-
148
-
149
-
150
-
151
-
152
 |
 |

2009/10 Annual Report Lenovo Group Limited
127127
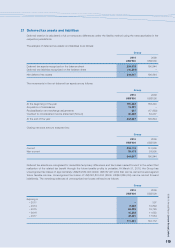
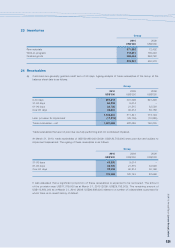
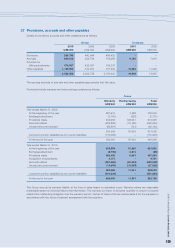
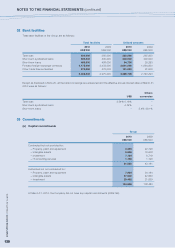
28 Non-current liabilities (continued)
(c) The current portion of non-current liabilities presented in the balance sheet are as follows:
Group Company
2010 2009 2008 2010 2009
US$’000 US$’000 US$’000 US$’000 US$’000
Marketing rights 7,575 – 11,443 – –
Electronic waste
disposal levy 2,975 2,359 2,138 – –
Interest-bearing
bank loans 230,000 435,000 35,000 230,000 435,000
Deferred revenue 196,806 203,514 180,846 – –
437,356 640,873 229,427 230,000 435,000
The interest-bearing bank loans classified as current portion of non-current liabilities comprise US$200 million (2009:
US$400 million) of the 5-year revolving term loan with syndicated banks and US$30 million (2009: US$35 million) of
the 5-year fixed rate loan facility with a bank in China.
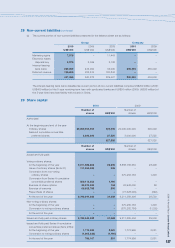
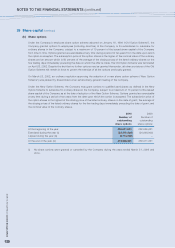
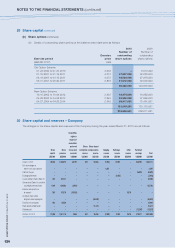
29 Share capital
2010
2009
Number of Number of
shares HK$’000 shares HK$’000
Authorized:
At the beginning and end of the year
Ordinary shares 20,000,000,000 500,000 20,000,000,000 500,000
Series A cumulative convertible
preferred shares 3,000,000 27,525 3,000,000 27,525
527,525 527,525
Number of Number of
shares US$’000 shares US$’000
Issued and fully paid:
Voting ordinary shares:
At the beginning of the year 9,211,389,406 29,530 8,888,786,650 28,496
Issue of ordinary shares (Note 37) 111,668,936 359 – –
Conversion from non-voting
ordinary shares – – 375,282,756 1,203
Conversion from Series A cumulative
convertible preferred shares 369,112,652 1,190 – –
Exercise of share options 32,370,500 104 24,948,000 80
Exercise of warrants 63,502,788 205 – –
Repurchase of shares – – (77,628,000) (249)
At the end of the year 9,788,044,282 31,388 9,211,389,406 29,530
Non-voting ordinary shares:
At the beginning of the year – – 375,282,756 1,203
Conversion to voting ordinary shares – – (375,282,756) (1,203)
At the end of the year – – – –
Issued and fully paid ordinary shares 9,788,044,282 31,388 9,211,389,406 29,530
Issued and fully paid Series A cumulative
convertible preferred shares (Note 28(b)):
At the beginning of the year 1,774,999 2,081 1,774,999 2,081
Conversion to voting ordinary shares (1,005,832) (1,190) – –
At the end of the year 769,167 891 1,774,999 2,081