Lenovo 2010 Annual Report Download - page 140
Download and view the complete annual report
Please find page 140 of the 2010 Lenovo annual report below. You can navigate through the pages in the report by either clicking on the pages listed below, or by using the keyword search tool below to find specific information within the annual report.-
 1
1 -
2
-
3
-
4
-
5
-
6
-
7
-
8
-
9
-
10
-
11
-
12
-
13
-
14
-
15
-
16
-
17
-
18
-
19
-
20
-
21
-
22
-
23
-
24
-
25
-
26
-
27
-
28
-
29
-
30
-
31
-
32
-
33
-
34
-
35
-
36
-
37
-
38
-
39
-
40
-
41
-
42
-
43
-
44
-
45
-
46
-
47
-
48
-
49
-
50
-
51
-
52
-
53
-
54
-
55
-
56
-
57
-
58
-
59
-
60
-
61
-
62
-
63
-
64
-
65
-
66
-
67
-
68
-
69
-
70
-
71
-
72
-
73
-
74
-
75
-
76
-
77
-
78
-
79
-
80
-
81
-
82
-
83
-
84
-
85
-
86
-
87
-
88
-
89
-
90
-
91
-
92
-
93
-
94
-
95
-
96
-
97
-
98
-
99
-
100
-
101
-
102
-
103
-
104
-
105
-
106
-
107
-
108
-
109
-
110
-
111
-
112
-
113
-
114
-
115
-
116
-
117
-
118
-
119
-
120
-
121
-
122
-
123
-
124
-
125
-
126
-
127
-
128
-
129
-
 130
130 -
 131
131 -
 132
132 -
 133
133 -
 134
134 -
 135
135 -
 136
136 -
 137
137 -
 138
138 -
 139
139 -
 140
140 -
 141
141 -
 142
142 -
 143
143 -
 144
144 -
 145
145 -
 146
146 -
 147
147 -
 148
148 -
 149
149 -
 150
150 -
151
-
152
 |
 |

2009/10 Annual Report Lenovo Group Limited
138
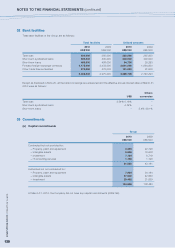
NOTES TO THE FINANCIAL STATEMENTS (continued)
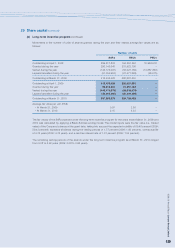
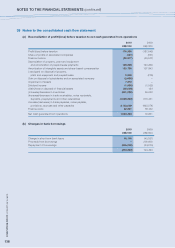
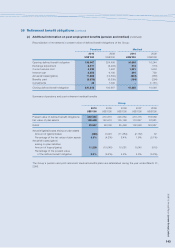
35 Notes to the consolidated cash flow statement
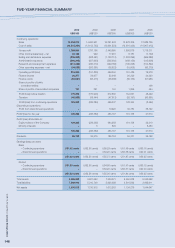
(a) Reconciliation of profit/(loss) before taxation to net cash generated from operations
2010 2009
US$’000 US$’000
Profit/(loss) before taxation 176,303 (187,945)
Share of profits of associated companies (121) (351)
Finance income (20,377) (59,977)
Depreciation of property, plant and equipment
and amortization of prepaid lease payments 100,826 143,269
Amortization of intangible assets and share-based compensation 120,756 137,843
Loss/(gain) on disposal of property,
plant and equipment and prepaid lease 3,369 (276)
Gain on disposal of subsidiaries and an associated company (2,600) –
Impairment of assets 7,372 –
Dividend income (1,558) (1,053)
(Gain)/loss on disposal of financial assets (82,090) 124
(Increase)/decrease in inventories (401,082) 26,028
(Increase)/decrease in trade receivables, notes receivable,
deposits, prepayments and other receivables (1,086,354) 616,431
Increase/(decrease) in trade payables, notes payable,
provisions, accruals and other payables 2,183,039 (692,274)
Finance costs 62,881 38,142
Net cash generated from operations 1,060,364 19,961
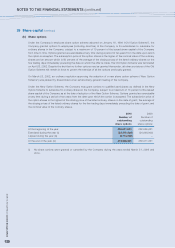
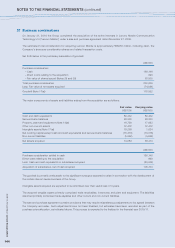
(b) Changes in bank borrowings
2010 2009
US$’000 US$’000
Change in short term bank loans 16,116 (40,837)
Proceeds from borrowings – 200,000
Repayment of borrowings (235,000) (34,670)
(218,884) 124,493