Lenovo 2010 Annual Report Download - page 102
Download and view the complete annual report
Please find page 102 of the 2010 Lenovo annual report below. You can navigate through the pages in the report by either clicking on the pages listed below, or by using the keyword search tool below to find specific information within the annual report.-
 1
1 -
2
-
3
-
4
-
5
-
6
-
7
-
8
-
9
-
10
-
11
-
12
-
13
-
14
-
15
-
16
-
17
-
18
-
19
-
20
-
21
-
22
-
23
-
24
-
25
-
26
-
27
-
28
-
29
-
30
-
31
-
32
-
33
-
34
-
35
-
36
-
37
-
38
-
39
-
40
-
41
-
42
-
43
-
44
-
45
-
46
-
47
-
48
-
49
-
50
-
51
-
52
-
53
-
54
-
55
-
56
-
57
-
58
-
59
-
60
-
61
-
62
-
63
-
64
-
65
-
66
-
67
-
68
-
69
-
70
-
71
-
72
-
73
-
74
-
75
-
76
-
77
-
78
-
79
-
80
-
81
-
82
-
83
-
84
-
85
-
86
-
87
-
88
-
89
-
90
-
91
-
 92
92 -
 93
93 -
 94
94 -
 95
95 -
 96
96 -
 97
97 -
 98
98 -
 99
99 -
 100
100 -
 101
101 -
 102
102 -
 103
103 -
 104
104 -
 105
105 -
 106
106 -
 107
107 -
 108
108 -
 109
109 -
 110
110 -
 111
111 -
 112
112 -
113
-
114
-
115
-
116
-
117
-
118
-
119
-
120
-
121
-
122
-
123
-
124
-
125
-
126
-
127
-
128
-
129
-
130
-
131
-
132
-
133
-
134
-
135
-
136
-
137
-
138
-
139
-
140
-
141
-
142
-
143
-
144
-
145
-
146
-
147
-
148
-
149
-
150
-
151
-
152
 |
 |

2009/10 Annual Report Lenovo Group Limited
100
NOTES TO THE FINANCIAL STATEMENTS (continued)
100
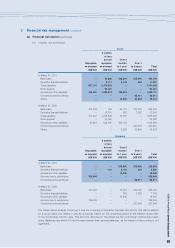
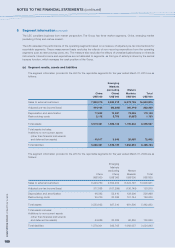
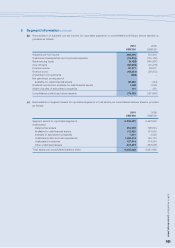
5 Segment information (continued)
The LEC considers business from market perspective. The Group has three market segments, China, emerging market
(excluding China) and mature market.
The LEC assesses the performance of the operating segments based on a measure of adjusted pre-tax income/(loss) for
reportable segments. These measurement basis excludes the effects of non-recurring expenditure from the operating
segments such as restructuring costs, etc. The measure also excludes the effects of unrealized gains/losses on financial
instruments. Interest income and expenditure are not allocated to segments, as this type of activity is driven by the central
treasury function, which manages the cash position of the Group.
(a) Segment results, assets and liabilities
The segment information provided to the LEC for the reportable segments for the year ended March 31, 2010 are as
follows:
Emerging
Markets
(excluding Mature
China China) Markets Total
US$’000 US$’000 US$’000 US$’000
Sales to external customers 7,892,275 2,639,812 6,072,728 16,604,815
Adjusted pre-tax income/(loss) 444,164 (96,625) (65,119) 282,420
Depreciation and amortization 77,833 19,297 73,039 170,169
Restructuring costs 2,112 5,708 (6,087) 1,733
Total assets 3,519,421 1,586,158 1,199,948 6,305,527
Total assets includes:
Additions to non-current assets
(other than financial instruments
and deferred tax assets) 49,017 3,540 20,085 72,642
Total liabilities 3,238,451 1,929,730 1,258,603 6,426,784
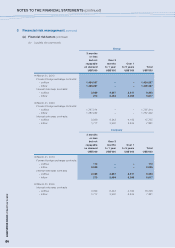
The segment information provided to the LEC for the reportable segments for the year ended March 31, 2009 are as
follows:
Emerging
Markets
(excluding Mature
China China) Markets Total
US$’000 US$’000 US$’000 US$’000
Sales to external customers 6,223,760 2,352,974 6,324,197 14,900,931
Adjusted pre-tax income/(loss) 377,858 (107,299) (136,749) 133,810
Depreciation and amortization 46,382 52,410 128,206 226,998
Restructuring costs 20,700 23,586 101,744 146,030
Total assets 3,533,922 927,510 981,500 5,442,932
Total assets includes:
Additions to non-current assets
(other than financial instruments
and deferred tax assets) 44,686 23,384 62,850 130,920
Total liabilities 1,579,301 382,705 1,062,057 3,024,063