Lenovo 2010 Annual Report Download - page 123
Download and view the complete annual report
Please find page 123 of the 2010 Lenovo annual report below. You can navigate through the pages in the report by either clicking on the pages listed below, or by using the keyword search tool below to find specific information within the annual report.-
 1
1 -
2
-
3
-
4
-
5
-
6
-
7
-
8
-
9
-
10
-
11
-
12
-
13
-
14
-
15
-
16
-
17
-
18
-
19
-
20
-
21
-
22
-
23
-
24
-
25
-
26
-
27
-
28
-
29
-
30
-
31
-
32
-
33
-
34
-
35
-
36
-
37
-
38
-
39
-
40
-
41
-
42
-
43
-
44
-
45
-
46
-
47
-
48
-
49
-
50
-
51
-
52
-
53
-
54
-
55
-
56
-
57
-
58
-
59
-
60
-
61
-
62
-
63
-
64
-
65
-
66
-
67
-
68
-
69
-
70
-
71
-
72
-
73
-
74
-
75
-
76
-
77
-
78
-
79
-
80
-
81
-
82
-
83
-
84
-
85
-
86
-
87
-
88
-
89
-
90
-
91
-
92
-
93
-
94
-
95
-
96
-
97
-
98
-
99
-
100
-
101
-
102
-
103
-
104
-
105
-
106
-
107
-
108
-
109
-
110
-
111
-
112
-
 113
113 -
 114
114 -
 115
115 -
 116
116 -
 117
117 -
 118
118 -
 119
119 -
 120
120 -
 121
121 -
 122
122 -
 123
123 -
 124
124 -
 125
125 -
 126
126 -
 127
127 -
 128
128 -
 129
129 -
 130
130 -
 131
131 -
 132
132 -
 133
133 -
134
-
135
-
136
-
137
-
138
-
139
-
140
-
141
-
142
-
143
-
144
-
145
-
146
-
147
-
148
-
149
-
150
-
151
-
152
 |
 |
2009/10 Annual Report Lenovo Group Limited
121121
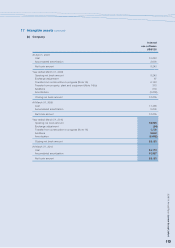
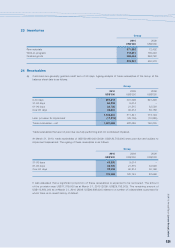
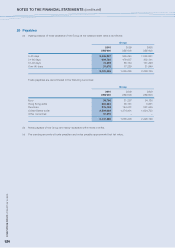
23 Inventories
Group
2010 2009
US$’000 US$’000
Raw materials 371,592 72,402
Work-in-progress 118,851 109,246
Finished goods 388,444 268,722
878,887 450,370
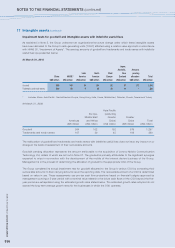
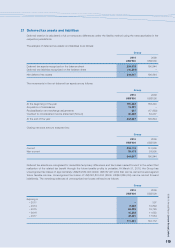
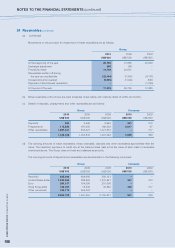
24 Receivables
(a) Customers are generally granted credit term of 30 days. Ageing analysis of trade receivables of the Group at the
balance sheet date is as follows:
Group
2010 2009 2008
US$’000 US$’000 US$’000
0-30 days 907,412 391,098 691,428
31-60 days 65,335 9,014 –
61-90 days 32,730 21,515 32,528
Over 90 days 32,904 90,214 50,168
1,038,381 511,841 774,124
Less: provision for impairment (17,319) (29,755) (13,885)
Trade receivables – net 1,021,062 482,086 760,239
Trade receivables that are not past due are fully performing and not considered impaired.
At March 31, 2010, trade receivables of US$130,969,000 (2009: US$120,743,000) were past due and subject to
impairment assessment. The ageing of these receivables is as follows:
Group
2010 2009 2008
US$’000 US$’000 US$’000
31-60 days 65,335 9,014 –
61-90 days 32,730 21,515 32,528
Over 90 days 32,904 90,214 50,168
130,969 120,743 82,696
It was assessed that a significant proportion of these receivables is expected to be recovered. The amount
of the provision was US$17,319,000 as at March 31, 2010 (2009: US$29,755,000). The remaining amount of
US$113,650,000 as at March 31, 2010 (2009: US$90,988,000) relates to a number of independent customers for
whom there is no recent history of default.