Lenovo 2010 Annual Report Download - page 105
Download and view the complete annual report
Please find page 105 of the 2010 Lenovo annual report below. You can navigate through the pages in the report by either clicking on the pages listed below, or by using the keyword search tool below to find specific information within the annual report.-
 1
1 -
2
-
3
-
4
-
5
-
6
-
7
-
8
-
9
-
10
-
11
-
12
-
13
-
14
-
15
-
16
-
17
-
18
-
19
-
20
-
21
-
22
-
23
-
24
-
25
-
26
-
27
-
28
-
29
-
30
-
31
-
32
-
33
-
34
-
35
-
36
-
37
-
38
-
39
-
40
-
41
-
42
-
43
-
44
-
45
-
46
-
47
-
48
-
49
-
50
-
51
-
52
-
53
-
54
-
55
-
56
-
57
-
58
-
59
-
60
-
61
-
62
-
63
-
64
-
65
-
66
-
67
-
68
-
69
-
70
-
71
-
72
-
73
-
74
-
75
-
76
-
77
-
78
-
79
-
80
-
81
-
82
-
83
-
84
-
85
-
86
-
87
-
88
-
89
-
90
-
91
-
92
-
93
-
94
-
 95
95 -
 96
96 -
 97
97 -
 98
98 -
 99
99 -
 100
100 -
 101
101 -
 102
102 -
 103
103 -
 104
104 -
 105
105 -
 106
106 -
 107
107 -
 108
108 -
 109
109 -
 110
110 -
 111
111 -
 112
112 -
 113
113 -
 114
114 -
 115
115 -
116
-
117
-
118
-
119
-
120
-
121
-
122
-
123
-
124
-
125
-
126
-
127
-
128
-
129
-
130
-
131
-
132
-
133
-
134
-
135
-
136
-
137
-
138
-
139
-
140
-
141
-
142
-
143
-
144
-
145
-
146
-
147
-
148
-
149
-
150
-
151
-
152
 |
 |

2009/10 Annual Report Lenovo Group Limited
103103
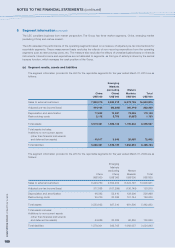
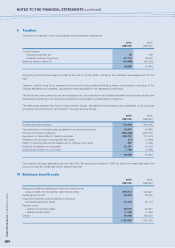
6 Other income – net
2010 2009
US$’000 US$’000
Net gain/(loss) on disposal of available-for-sale
financial assets 82,090 (124)
Dividend income from available-for-sale financial assets 1,558 1,053
Impairment of investments (522) –
83,126 929
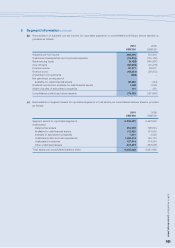
7 Expenses by nature
2010 2009
US$’000 US$’000
Depreciation of property, plant and equipment and
amortization of prepaid lease payments 100,826 143,269
Amortization and impairment of intangible assets 70,202 83,729
Employees’ benefit costs (Note 10) 1,182,019 1,237,250
Cost of inventories sold 14,105,889 12,487,576
Auditor’s remuneration 3,640 5,620
Termination of onerous contracts (63) 19,996
Rental expenses under operating leases 44,729 45,976
8 Finance income and costs
(a) Finance income
2010 2009
US$’000 US$’000
Interest on bank deposits 18,947 54,351
Interest on money market funds 950 5,570
Others 480 56
20,377 59,977
(b) Finance costs
2010 2009
US$’000 US$’000
Interest on bank loans and overdrafts 30,413 22,310
Dividend and relevant finance costs on
convertible preferred shares (Note 28(b)) 10,915 14,115
Factoring cost 10,600 18,331
Others 10,953 1,717
62,881 56,473