Lenovo 2010 Annual Report Download - page 24
Download and view the complete annual report
Please find page 24 of the 2010 Lenovo annual report below. You can navigate through the pages in the report by either clicking on the pages listed below, or by using the keyword search tool below to find specific information within the annual report.-
 1
1 -
2
-
3
-
4
-
5
-
6
-
7
-
8
-
9
-
10
-
11
-
12
-
13
-
 14
14 -
 15
15 -
 16
16 -
 17
17 -
 18
18 -
 19
19 -
 20
20 -
 21
21 -
 22
22 -
 23
23 -
 24
24 -
 25
25 -
 26
26 -
 27
27 -
 28
28 -
 29
29 -
 30
30 -
 31
31 -
 32
32 -
 33
33 -
 34
34 -
35
-
36
-
37
-
38
-
39
-
40
-
41
-
42
-
43
-
44
-
45
-
46
-
47
-
48
-
49
-
50
-
51
-
52
-
53
-
54
-
55
-
56
-
57
-
58
-
59
-
60
-
61
-
62
-
63
-
64
-
65
-
66
-
67
-
68
-
69
-
70
-
71
-
72
-
73
-
74
-
75
-
76
-
77
-
78
-
79
-
80
-
81
-
82
-
83
-
84
-
85
-
86
-
87
-
88
-
89
-
90
-
91
-
92
-
93
-
94
-
95
-
96
-
97
-
98
-
99
-
100
-
101
-
102
-
103
-
104
-
105
-
106
-
107
-
108
-
109
-
110
-
111
-
112
-
113
-
114
-
115
-
116
-
117
-
118
-
119
-
120
-
121
-
122
-
123
-
124
-
125
-
126
-
127
-
128
-
129
-
130
-
131
-
132
-
133
-
134
-
135
-
136
-
137
-
138
-
139
-
140
-
141
-
142
-
143
-
144
-
145
-
146
-
147
-
148
-
149
-
150
-
151
-
152
 |
 |

2009/10 Annual Report Lenovo Group Limited
22
MANAGEMENT’S DISCUSSION & ANALYSIS
FINANCIAL
REVIEW
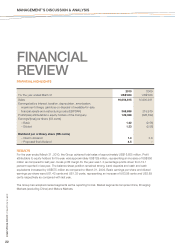
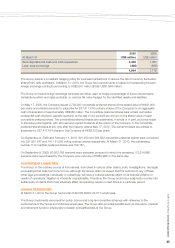
FINANCIAL HIGHLIGHTS
2010 2009
For the year ended Mach 31 US$’000 US$’000
Sales 16,604,815 14,900,931
Earnings before interest, taxation, depreciation, amortization,
impairment charge, gain/loss on disposal of available-for-sale
financial assets and restructuring costs (EBITDAR) 368,888 215,979
Profit/(loss) attributable to equity holders of the Company 129,368 (226,392)
Earnings/(loss) per share (US cents)
– Basic 1.42 (2.56)
– Diluted 1.33 (2.56)
Dividend per ordinary share (HK cents)
– Interim dividend 1.0 3.0
– Proposed final dividend 4.5 –
RESULTS
For the year ended March 31, 2010, the Group achieved total sales of approximately US$16,605 million. Profit
attributable to equity holders for the year was approximately US$129 million, representing an increase of US$356
million as compared to last year. Gross profit margin for the year was 1.3 percentage points down from 12.1
percent reported in last year. The balance sheet position remained strong, bank deposits and cash and cash
equivalents increased by US$575 million as compared to March 31, 2009. Basic earnings per share and diluted
earnings per share were US1.42 cents and US1.33 cents, representing an increase of US3.98 cents and US3.89
cents respectively as compared with last year.
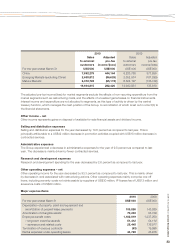
The Group has adopted market segments as the reporting format. Market segments comprise China, Emerging
Markets (excluding China) and Mature Markets.