Lenovo 2010 Annual Report Download - page 120
Download and view the complete annual report
Please find page 120 of the 2010 Lenovo annual report below. You can navigate through the pages in the report by either clicking on the pages listed below, or by using the keyword search tool below to find specific information within the annual report.-
 1
1 -
2
-
3
-
4
-
5
-
6
-
7
-
8
-
9
-
10
-
11
-
12
-
13
-
14
-
15
-
16
-
17
-
18
-
19
-
20
-
21
-
22
-
23
-
24
-
25
-
26
-
27
-
28
-
29
-
30
-
31
-
32
-
33
-
34
-
35
-
36
-
37
-
38
-
39
-
40
-
41
-
42
-
43
-
44
-
45
-
46
-
47
-
48
-
49
-
50
-
51
-
52
-
53
-
54
-
55
-
56
-
57
-
58
-
59
-
60
-
61
-
62
-
63
-
64
-
65
-
66
-
67
-
68
-
69
-
70
-
71
-
72
-
73
-
74
-
75
-
76
-
77
-
78
-
79
-
80
-
81
-
82
-
83
-
84
-
85
-
86
-
87
-
88
-
89
-
90
-
91
-
92
-
93
-
94
-
95
-
96
-
97
-
98
-
99
-
100
-
101
-
102
-
103
-
104
-
105
-
106
-
107
-
108
-
109
-
 110
110 -
 111
111 -
 112
112 -
 113
113 -
 114
114 -
 115
115 -
 116
116 -
 117
117 -
 118
118 -
 119
119 -
 120
120 -
 121
121 -
 122
122 -
 123
123 -
 124
124 -
 125
125 -
 126
126 -
 127
127 -
 128
128 -
 129
129 -
 130
130 -
131
-
132
-
133
-
134
-
135
-
136
-
137
-
138
-
139
-
140
-
141
-
142
-
143
-
144
-
145
-
146
-
147
-
148
-
149
-
150
-
151
-
152
 |
 |

2009/10 Annual Report Lenovo Group Limited
118
NOTES TO THE FINANCIAL STATEMENTS (continued)
118
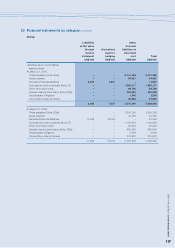
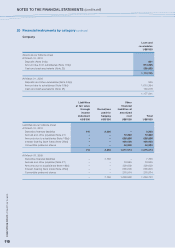
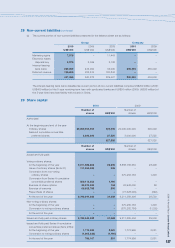
20 Financial instruments by category (continued)
Company
Loan and
receivables
US$’000
Assets as per balance sheet
At March 31, 2010
Deposits (Note 24(c)) 881
Amount due from subsidiaries (Note 18(b)) 914,325
Cash and cash equivalents (Note 25) 259,559
1,174,765
At March 31, 2009
Deposits and other receivables (Note 24(c)) 529
Amount due to subsidiaries (Note 18(b)) 1,013,394
Cash and cash equivalents (Note 25) 163,618
1,177,541
Liabilities Other
at fair value financial
through Derivatives liabilities at
income used for amortized
statement hedging cost Total
US$’000 US$’000 US$’000 US$’000
Liabilities as per balance sheet
At March 31, 2010
Derivative financial liabilities 110 3,390 – 3,500
Accrual and other payables (Note 27) – – 19,848 19,848
Amounts due to subsidiaries (Note 18(b)) – – 526,686 526,686
Interest-bearing bank loans (Note 28(a)) – – 430,000 430,000
Convertible preferred shares – – 94,980 94,980
110 3,390 1,071,514 1,075,014
At March 31, 2009
Derivative financial liabilities – 7,765 – 7,765
Accrual and other payables (Note 27) – – 18,945 18,945
Amounts due to subsidiaries (Note 18(b)) – – 329,039 329,039
Interest-bearing bank loans (Note 28(a)) – – 665,000 665,000
Convertible preferred shares – – 215,974 215,974
– 7,765 1,228,958 1,236,723