Lenovo 2010 Annual Report Download - page 41
Download and view the complete annual report
Please find page 41 of the 2010 Lenovo annual report below. You can navigate through the pages in the report by either clicking on the pages listed below, or by using the keyword search tool below to find specific information within the annual report.-
 1
1 -
2
-
3
-
4
-
5
-
6
-
7
-
8
-
9
-
10
-
11
-
12
-
13
-
14
-
15
-
16
-
17
-
18
-
19
-
20
-
21
-
22
-
23
-
24
-
25
-
26
-
27
-
28
-
29
-
30
-
 31
31 -
 32
32 -
 33
33 -
 34
34 -
 35
35 -
 36
36 -
 37
37 -
 38
38 -
 39
39 -
 40
40 -
 41
41 -
 42
42 -
 43
43 -
 44
44 -
 45
45 -
 46
46 -
 47
47 -
 48
48 -
 49
49 -
 50
50 -
 51
51 -
52
-
53
-
54
-
55
-
56
-
57
-
58
-
59
-
60
-
61
-
62
-
63
-
64
-
65
-
66
-
67
-
68
-
69
-
70
-
71
-
72
-
73
-
74
-
75
-
76
-
77
-
78
-
79
-
80
-
81
-
82
-
83
-
84
-
85
-
86
-
87
-
88
-
89
-
90
-
91
-
92
-
93
-
94
-
95
-
96
-
97
-
98
-
99
-
100
-
101
-
102
-
103
-
104
-
105
-
106
-
107
-
108
-
109
-
110
-
111
-
112
-
113
-
114
-
115
-
116
-
117
-
118
-
119
-
120
-
121
-
122
-
123
-
124
-
125
-
126
-
127
-
128
-
129
-
130
-
131
-
132
-
133
-
134
-
135
-
136
-
137
-
138
-
139
-
140
-
141
-
142
-
143
-
144
-
145
-
146
-
147
-
148
-
149
-
150
-
151
-
152
 |
 |
2009/10 Annual Report Lenovo Group Limited
39
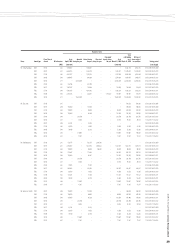
Number of units
Name Award type
Fiscal Year of
Award Effective price
As at
April 1, 2009
Awarded
during the year
Vested during
the year
Exercised
during the year
Cancelled/
lapsed during
the year
As at
March 31, 2010
Total
outstanding
as at
March 31, 2010
Max no. of
shares subject
to conditions Vesting period
(HK$) (unvested) (unvested) (mm.dd.yyyy)
Mr. Yang Yuanqing SAR 05/06 2.42 1,590,667 – 1,590,667 – – – 6,362,756 6,362,756 05.01.2006-05.01.2009
SAR 06/07 2.35 6,692,833 – 3,346,416 – – 3,346,417 13,385,665 13,385,665 06.01.2007-06.01.2010
SAR 07/08 3.94 4,501,507 – 1,500,502 – – 3,001,005 6,002,009 6,002,009 06.01.2008-06.01.2011
SAR 08/09 5.88 3,939,855 – 984,964 – – 2,954,891 3,939,855 3,939,855 06.01.2009-06.01.2012
SAR 09/10 3.17 – 22,800,000 – – – 22,800,000 22,800,000 22,800,000 05.25,2010-05.25,2013
RSU 05/06 2.42 232,196 – 232,196 – – – – – 05.01.2006-05.01.2009
RSU 06/07 2.35 1,487,297 – 743,648 – – 743,649 743,649 743,649 06.01.2007-06.01.2010
RSU 07/08 3.94 5,043,303 – 1,681,102 – – 3,362,201 3,362,201 3,362,201 06.01.2008-06.01.2011
RSU 08/09 5.88 2,801,675 – 262,657 – 1,751,047 787,971 787,971 787,971 06.01.2009-06.01.2012
RSU 09/10 3.17 – 10,200,000 – – – 10,200,000 10,200,000 10,200,000 05.25,2010-05.25,2013
Mr. Zhu Linan SAR 05/06 3.15 – – – – – – 564,000 564,000 05.01.2006-05.01.2008
SAR 06/07 2.99 130,000 – 130,000 – – – 390,000 390,000 06.01.2007-06.01.2009
SAR 07/08 3.94 198,000 – 99,000 – – 99,000 297,000 297,000 06.01.2008-06.01.2010
SAR 08/09 5.88 195,980 – 65,326 – – 130,654 195,980 195,980 06.01.2009-06.01.2011
SAR 09/10 3.88 – 263,796 – – – 263,796 263,796 263,796 08.07.2010-08.07.2012
SAR 09/10 4.47 – 38,163 – – – 38,163 38,163 38,163 11.30.2010-11.30.2012
RSU 06/07 2.99 43,334 – 43,334 – – – – – 06.01.2007-06.01.2009
RSU 07/08 3.94 66,000 – 33,000 – – 33,000 33,000 33,000 06.01.2008-06.01.2010
RSU 08/09 5.88 78,390 – 26,130 – – 52,260 52,260 52,260 06.01.2009-06.01.2011
RSU 09/10 3.88 – 119,907 – – – 119,907 119,907 119,907 08.07.2010-08.07.2012
RSU 09/10 4.47 – 17,347 – – – 17,347 17,347 17,347 11.30.2010-11.30.2012
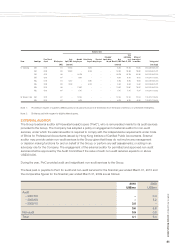
Ms. Ma Xuezheng SAR 05/06 2.42 520,375 – 520,375 2,081,500 – – – – 05.01.2006-05.01.2009
SAR 06/07 2.35 2,054,947 – 1,027,474 3,082,422 – 1,027,473 1,027,473 1,027,473 06.01.2007-06.01.2010
SAR 07/08 3.94 198,000 – 99,000 198,000 – 99,000 99,000 99,000 06.01.2008-06.01.2010
SAR 07/08 5.62 519,847 – 173,282 – – 346,565 693,130 693,130 06.01.2008-06.01.2011
SAR 08/09 5.88 195,980 – 65,327 – – 130,653 195,980 195,980 06.01.2009-06.01.2011
SAR 09/10 3.88 – 263,796 – – – 263,796 263,796 263,796 08.07.2010-08.07.2012
SAR 09/10 4.47 – 38,163 – – – 38,163 38,163 38,163 11.30.2010-11.30.2012
RSU 05/06 2.42 75,975 – 75,975 – – – – – 05.01.2006-05.01.2009
RSU 06/07 2.35 684,983 – 342,492 – – 342,491 342,491 342,491 06.01.2007-06.01.2010
RSU 07/08 3.94 66,000 – 33,000 – – 33,000 33,000 33,000 06.01.2008-06.01.2010
RSU 07/08 5.62 173,281 – 57,760 – – 115,521 115,521 115,521 06.01.2008-06.01.2011
RSU 08/09 5.88 78,390 – 26,130 – – 52,260 52,260 52,260 06.01.2009-06.01.2011
RSU 09/10 3.88 – 119,907 – – – 119,907 119,907 119,907 08.07.2010-08.07.2012
RSU 09/10 4.47 – 17,347 – – – 17,347 17,347 17,347 11.30.2010-11.30.2012
Mr. James G. Coulter SAR 06/07 2.99 130,000 – 130,000 – – – 390,000 390,000 06.01.2007-06.01.2009
SAR 07/08 3.94 198,000 – 99,000 – – 99,000 297,000 297,000 06.01.2008-06.01.2010
SAR 08/09 5.88 195,980 – 65,326 – – 130,654 195,980 195,980 06.01.2009-06.01.2011
SAR 09/10 3.88 – 263,796 – – – 263,796 263,796 263,796 08.07.2010-08.07.2012
SAR 09/10 4.47 – 38,163 – – – 38,163 38,163 38,163 11.30.2010-11.30.2012
RSU 06/07 2.99 43,334 – 43,334 – – – – – 06.01.2007-06.01.2009
RSU 07/08 3.94 66,000 – 33,000 – – 33,000 33,000 33,000 06.01.2008-06.01.2010
RSU 08/09 5.88 78,390 – 26,130 – – 52,260 52,260 52,260 06.01.2009-06.01.2011
RSU 09/10 3.88 – 119,907 – – – 119,907 119,907 119,907 08.07.2010-08.07.2012
RSU 09/10 4.47 – 17,347 – – – 17,347 17,347 17,347 11.30.2010-11.30.2012