Lenovo 2010 Annual Report Download - page 133
Download and view the complete annual report
Please find page 133 of the 2010 Lenovo annual report below. You can navigate through the pages in the report by either clicking on the pages listed below, or by using the keyword search tool below to find specific information within the annual report.-
 1
1 -
2
-
3
-
4
-
5
-
6
-
7
-
8
-
9
-
10
-
11
-
12
-
13
-
14
-
15
-
16
-
17
-
18
-
19
-
20
-
21
-
22
-
23
-
24
-
25
-
26
-
27
-
28
-
29
-
30
-
31
-
32
-
33
-
34
-
35
-
36
-
37
-
38
-
39
-
40
-
41
-
42
-
43
-
44
-
45
-
46
-
47
-
48
-
49
-
50
-
51
-
52
-
53
-
54
-
55
-
56
-
57
-
58
-
59
-
60
-
61
-
62
-
63
-
64
-
65
-
66
-
67
-
68
-
69
-
70
-
71
-
72
-
73
-
74
-
75
-
76
-
77
-
78
-
79
-
80
-
81
-
82
-
83
-
84
-
85
-
86
-
87
-
88
-
89
-
90
-
91
-
92
-
93
-
94
-
95
-
96
-
97
-
98
-
99
-
100
-
101
-
102
-
103
-
104
-
105
-
106
-
107
-
108
-
109
-
110
-
111
-
112
-
113
-
114
-
115
-
116
-
117
-
118
-
119
-
120
-
121
-
122
-
 123
123 -
 124
124 -
 125
125 -
 126
126 -
 127
127 -
 128
128 -
 129
129 -
 130
130 -
 131
131 -
 132
132 -
 133
133 -
 134
134 -
 135
135 -
 136
136 -
 137
137 -
 138
138 -
 139
139 -
 140
140 -
 141
141 -
 142
142 -
 143
143 -
144
-
145
-
146
-
147
-
148
-
149
-
150
-
151
-
152
 |
 |

2009/10 Annual Report Lenovo Group Limited
131131
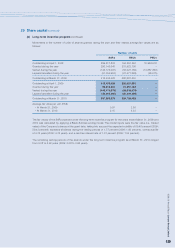
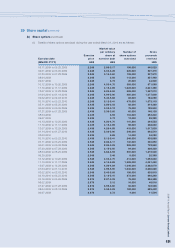
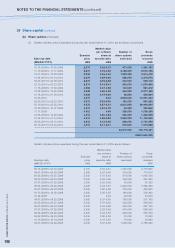
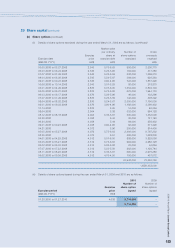
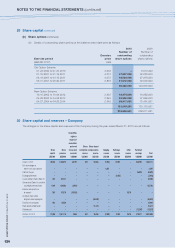
29 Share capital (continued)
(b) Share options (continued)
(ii) Details of share options exercised during the year ended March 31, 2010 are as follows:
Market value
per ordinary Number of Gross
Exercise share at share options proceeds
Exercise date price exercise date exercised received
(MM.DD.YYYY) HK$ HK$ HK$
05.11.2009 to 05.25.2009 2.245 2.86-3.17 196,000 440,020
06.01.2009 to 06.05.2009 2.245 3.03-3.29 226,000 507,370
07.20.2009 to 07.28.2009 2.245 3.15-3.60 106,000 237,970
08.04.2009 2.245 3.93 112,000 251,440
09.07.2009 2.245 3.72 20,000 44,900
10.12.2009 to 10.20.2009 2.245 4.03-4.70 388,000 871,060
11.10.2009 to 11.17.2009 2.245 4.15-4.69 1,622,000 3,641,390
12.07.2009 to 12.28.2009 2.245 4.26-4.84 698,000 1,567,010
01.04.2010 to 01.14.2010 2.245 4.99-5.90 480,000 1,077,600
02.02.2010 to 02.03.2010 2.245 5.40-5.68 82,000 184,090
03.10.2010 to 03.23.2010 2.245 5.12-5.41 478,000 1,073,110
05.11.2009 to 05.26.2009 2.435 2.86-3.03 88,000 214,280
06.02.2009 to 06.05.2009 2.435 3.03-3.12 78,000 189,930
07.21.2009 to 07.28.2009 2.435 3.36-3.60 60,000 146,100
08.04.2009 2.435 3.93 104,000 253,240
09.07.2009 2.435 3.72 12,000 29,220
10.13.2009 to 10.20.2009 2.435 4.20-4.70 141,500 344,553
11.10.2009 to 11.17.2009 2.435 4.15-4.69 98,000 238,630
12.07.2009 to 12.29.2009 2.435 4.26-4.85 418,000 1,017,830
01.14.2010 to 01.27.2010 2.435 5.08-5.90 346,000 842,510
02.03.2010 2.435 5.68 14,000 34,090
03.10.2010 to 03.23.2010 2.435 5.12-5.41 248,000 603,880
05.11.2009 to 05.25.2009 2.545 2.86-3.17 130,000 330,850
06.01.2009 to 06.08.2009 2.545 2.86-3.29 288,000 732,960
07.20.2009 to 07.28.2009 2.545 3.15-3.60 94,000 239,230
08.04.2009 to 08.25.2009 2.545 3.62-3.93 500,000 1,272,500
09.29.2009 2.545 3.48 8,000 20,360
10.12.2009 to 10.20.2009 2.545 4.03-4.70 414,000 1,053,630
11.10.2009 to 11.17.2009 2.545 4.15-4.69 1,588,000 4,041,460
12.07.2009 to 12.28.2009 2.545 4.26-4.84 1,046,000 2,662,070
01.04.2010 to 01.14.2010 2.545 4.99-5.90 1,036,000 2,636,620
02.02.2010 to 02.03.2010 2.545 5.40-5.68 198,000 503,910
03.10.2010 to 03.23.2010 2.545 5.12-5.41 272,000 692,240
05.19.2009 to 05.26.2009 2.876 2.87-3.03 78,000 224,328
06.02.2009 2.876 3.12 16,000 46,016
07.27.2009 to 07.28.2009 2.876 3.59-3.60 36,000 103,536
08.04.2009 to 08.18.2009 2.876 3.59-3.93 182,000 523,432
09.07.2009 2.876 3.72 4,000 11,504