Lenovo 2010 Annual Report Download - page 73
Download and view the complete annual report
Please find page 73 of the 2010 Lenovo annual report below. You can navigate through the pages in the report by either clicking on the pages listed below, or by using the keyword search tool below to find specific information within the annual report.-
 1
1 -
2
-
3
-
4
-
5
-
6
-
7
-
8
-
9
-
10
-
11
-
12
-
13
-
14
-
15
-
16
-
17
-
18
-
19
-
20
-
21
-
22
-
23
-
24
-
25
-
26
-
27
-
28
-
29
-
30
-
31
-
32
-
33
-
34
-
35
-
36
-
37
-
38
-
39
-
40
-
41
-
42
-
43
-
44
-
45
-
46
-
47
-
48
-
49
-
50
-
51
-
52
-
53
-
54
-
55
-
56
-
57
-
58
-
59
-
60
-
61
-
62
-
 63
63 -
 64
64 -
 65
65 -
 66
66 -
 67
67 -
 68
68 -
 69
69 -
 70
70 -
 71
71 -
 72
72 -
 73
73 -
 74
74 -
 75
75 -
 76
76 -
 77
77 -
 78
78 -
 79
79 -
 80
80 -
 81
81 -
 82
82 -
 83
83 -
84
-
85
-
86
-
87
-
88
-
89
-
90
-
91
-
92
-
93
-
94
-
95
-
96
-
97
-
98
-
99
-
100
-
101
-
102
-
103
-
104
-
105
-
106
-
107
-
108
-
109
-
110
-
111
-
112
-
113
-
114
-
115
-
116
-
117
-
118
-
119
-
120
-
121
-
122
-
123
-
124
-
125
-
126
-
127
-
128
-
129
-
130
-
131
-
132
-
133
-
134
-
135
-
136
-
137
-
138
-
139
-
140
-
141
-
142
-
143
-
144
-
145
-
146
-
147
-
148
-
149
-
150
-
151
-
152
 |
 |

2009/10 Annual Report Lenovo Group Limited
71
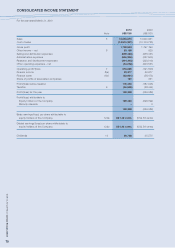
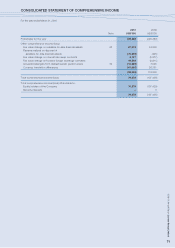
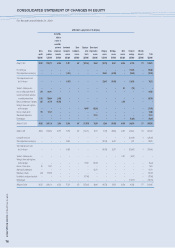
CONSOLIDATED STATEMENT OF COMPREHENSIVE INCOME
For the year ended March 31, 2010
2010 2009
Note US$’000 US$’000
Profit/(loss) for the year 129,368 (226,389)
Other comprehensive income/(loss):
Fair value change on available-for-sale financial assets 22 67,674 34,830
Reserve realized on disposal of
available-for-sale financial assets (70,809) (465)
Fair value change on interest rate swap contracts 4,127 (5,977)
Fair value change on forward foreign exchange contracts 18,518 (8,811)
Actuarial (loss)/gain from defined benefit pension plans 36 (10,840) 7,025
Currency translation differences (61,660) 92,351
(52,990) 118,953
Total comprehensive income/(loss) 76,378 (107,436)
Total comprehensive income/(loss) attributable to:
Equity holders of the Company 76,378 (107,439)
Minority interests – 3
76,378 (107,436)