Lenovo 2010 Annual Report Download - page 122
Download and view the complete annual report
Please find page 122 of the 2010 Lenovo annual report below. You can navigate through the pages in the report by either clicking on the pages listed below, or by using the keyword search tool below to find specific information within the annual report.-
 1
1 -
2
-
3
-
4
-
5
-
6
-
7
-
8
-
9
-
10
-
11
-
12
-
13
-
14
-
15
-
16
-
17
-
18
-
19
-
20
-
21
-
22
-
23
-
24
-
25
-
26
-
27
-
28
-
29
-
30
-
31
-
32
-
33
-
34
-
35
-
36
-
37
-
38
-
39
-
40
-
41
-
42
-
43
-
44
-
45
-
46
-
47
-
48
-
49
-
50
-
51
-
52
-
53
-
54
-
55
-
56
-
57
-
58
-
59
-
60
-
61
-
62
-
63
-
64
-
65
-
66
-
67
-
68
-
69
-
70
-
71
-
72
-
73
-
74
-
75
-
76
-
77
-
78
-
79
-
80
-
81
-
82
-
83
-
84
-
85
-
86
-
87
-
88
-
89
-
90
-
91
-
92
-
93
-
94
-
95
-
96
-
97
-
98
-
99
-
100
-
101
-
102
-
103
-
104
-
105
-
106
-
107
-
108
-
109
-
110
-
111
-
 112
112 -
 113
113 -
 114
114 -
 115
115 -
 116
116 -
 117
117 -
 118
118 -
 119
119 -
 120
120 -
 121
121 -
 122
122 -
 123
123 -
 124
124 -
 125
125 -
 126
126 -
 127
127 -
 128
128 -
 129
129 -
 130
130 -
 131
131 -
 132
132 -
133
-
134
-
135
-
136
-
137
-
138
-
139
-
140
-
141
-
142
-
143
-
144
-
145
-
146
-
147
-
148
-
149
-
150
-
151
-
152
 |
 |
2009/10 Annual Report Lenovo Group Limited
120
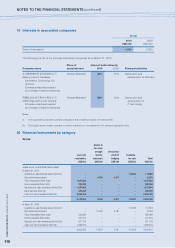
NOTES TO THE FINANCIAL STATEMENTS (continued)
120
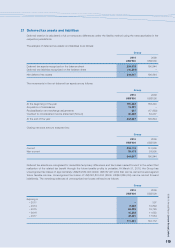
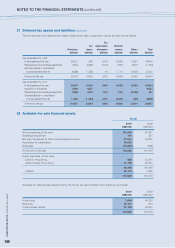
21 Deferred tax assets and liabilities (continued)
The movements in net deferred tax assets, analyzed by major component, during the year are as follows:
Tax
Tax depreciation Deferred
Provisions losses allowances revenue Others Total
US$’000 US$’000 US$’000 US$’000 US$’000 US$’000
Year ended March 31, 2009
At the beginning of the year 99,322 7,658 5,975 29,634 13,851 156,440
Reclassification and exchange adjustments (1,540) (5,695) (2,216) (1,881) (6,501) (17,833)
(Debited)/credited to consolidated
income statement (Note 9) (9,599) 17,556 64 17,713 26,503 52,237
At the end of the year 88,183 19,519 3,823 45,466 33,853 190,844
Year ended March 31, 2010
At the beginning of the year 88,183 19,519 3,823 45,466 33,853 190,844
Acquisition of subsidiaries 6,000 6,327 – – – 12,327
Reclassification and exchange adjustments (1,568) 9,079 1,419 1,763 (10,056) 637
Credited/(debited) to consolidated
income statement (Note 9) 11,482 (11,025) 4,191 36,409 (218) 40,839
At the end of the year 104,097 23,900 9,433 83,638 23,579 244,647
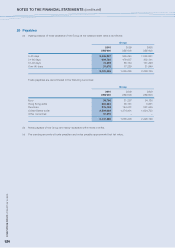
22 Available-for-sale financial assets
Group
2010 2009
US$’000 US$’000
At the beginning of the year 101,916 67,697
Exchange adjustment 191 247
Net gain transferred to other comprehensive income 67,674 34,830
Acquisition of subsidiaries 18,020 –
Disposals (75,281) (858)
At the end of the year 112,520 101,916
Equity securities, at fair value
Listed in Hong Kong 636 33,215
Listed outside Hong Kong 91,769 66,821
92,405 100,036
Unlisted 20,115 1,880
112,520 101,916
Available-for-sale financial assets held by the Group are denominated in the following currencies:
2010 2009
US$’000 US$’000
Hong Kong 1,640 34,220
Renminbi 19,111 875
United States dollars 91,769 66,821
112,520 101,916