Lenovo 2010 Annual Report Download - page 113
Download and view the complete annual report
Please find page 113 of the 2010 Lenovo annual report below. You can navigate through the pages in the report by either clicking on the pages listed below, or by using the keyword search tool below to find specific information within the annual report.-
 1
1 -
2
-
3
-
4
-
5
-
6
-
7
-
8
-
9
-
10
-
11
-
12
-
13
-
14
-
15
-
16
-
17
-
18
-
19
-
20
-
21
-
22
-
23
-
24
-
25
-
26
-
27
-
28
-
29
-
30
-
31
-
32
-
33
-
34
-
35
-
36
-
37
-
38
-
39
-
40
-
41
-
42
-
43
-
44
-
45
-
46
-
47
-
48
-
49
-
50
-
51
-
52
-
53
-
54
-
55
-
56
-
57
-
58
-
59
-
60
-
61
-
62
-
63
-
64
-
65
-
66
-
67
-
68
-
69
-
70
-
71
-
72
-
73
-
74
-
75
-
76
-
77
-
78
-
79
-
80
-
81
-
82
-
83
-
84
-
85
-
86
-
87
-
88
-
89
-
90
-
91
-
92
-
93
-
94
-
95
-
96
-
97
-
98
-
99
-
100
-
101
-
102
-
 103
103 -
 104
104 -
 105
105 -
 106
106 -
 107
107 -
 108
108 -
 109
109 -
 110
110 -
 111
111 -
 112
112 -
 113
113 -
 114
114 -
 115
115 -
 116
116 -
 117
117 -
 118
118 -
 119
119 -
 120
120 -
 121
121 -
 122
122 -
 123
123 -
124
-
125
-
126
-
127
-
128
-
129
-
130
-
131
-
132
-
133
-
134
-
135
-
136
-
137
-
138
-
139
-
140
-
141
-
142
-
143
-
144
-
145
-
146
-
147
-
148
-
149
-
150
-
151
-
152
 |
 |

2009/10 Annual Report Lenovo Group Limited
111111
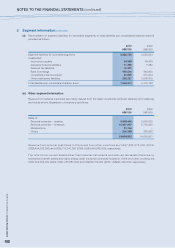
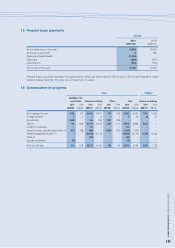
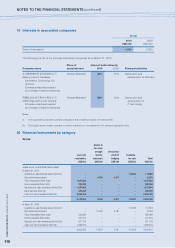
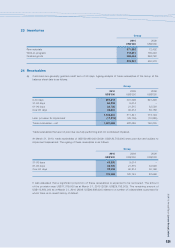
15 Prepaid lease payments
Group
2010 2009
US$’000 US$’000
At the beginning of the year 5,833 6,099
Exchange adjustment 8 159
Disposal of subsidiaries (1,660) –
Disposals (308) (271)
Amortization (125) (154)
At the end of the year 3,748 5,833
Prepaid lease payments represent the payments for land use rights held by the Group in the Chinese Mainland under
medium leases (less than 50 years but not less than 10 years).
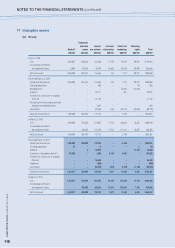
16 Construction-in-progress
Group Company
Buildings under
construction Internal use software Others Total Internal use software
2010 2009 2010 2009 2010 2009 2010 2009 2010 2009
US$’000 US$’000 US$’000 US$’000 US$’000 US$’000 US$’000 US$’000 US$’000 US$’000
At the beginning of the year 2,158 871 44,156 49,307 748 1,059 47,062 51,237 7,780 13,893
Exchange adjustment 2 6 5 18 1 2 8 26 (6) 20
Reclassification (1,253) – 246 908 1,007 (908) – – – –
Additions 196 1,846 37,125 61,032 2,658 1,110 39,979 63,988 2,206 –
Acquisition of subsidiaries – – 145 – – – 145 – – –
Transfer to property, plant and equipment (Note 14) (611) (565) (658) – (3,889) (515) (5,158) (1,080) – –
Transfer to intangible assets (Note 17) – – (56,499) (67,109) – – (56,499) (67,109) (7,776) (6,133)
Written-off – – (748) – – – (748) – – –
Disposals of subsidiaries (78) – – – – – (78) – – –
At the end of the year 414 2,158 23,772 44,156 525 748 24,711 47,062 2,204 7,780