Lenovo 2010 Annual Report Download - page 144
Download and view the complete annual report
Please find page 144 of the 2010 Lenovo annual report below. You can navigate through the pages in the report by either clicking on the pages listed below, or by using the keyword search tool below to find specific information within the annual report.-
 1
1 -
2
-
3
-
4
-
5
-
6
-
7
-
8
-
9
-
10
-
11
-
12
-
13
-
14
-
15
-
16
-
17
-
18
-
19
-
20
-
21
-
22
-
23
-
24
-
25
-
26
-
27
-
28
-
29
-
30
-
31
-
32
-
33
-
34
-
35
-
36
-
37
-
38
-
39
-
40
-
41
-
42
-
43
-
44
-
45
-
46
-
47
-
48
-
49
-
50
-
51
-
52
-
53
-
54
-
55
-
56
-
57
-
58
-
59
-
60
-
61
-
62
-
63
-
64
-
65
-
66
-
67
-
68
-
69
-
70
-
71
-
72
-
73
-
74
-
75
-
76
-
77
-
78
-
79
-
80
-
81
-
82
-
83
-
84
-
85
-
86
-
87
-
88
-
89
-
90
-
91
-
92
-
93
-
94
-
95
-
96
-
97
-
98
-
99
-
100
-
101
-
102
-
103
-
104
-
105
-
106
-
107
-
108
-
109
-
110
-
111
-
112
-
113
-
114
-
115
-
116
-
117
-
118
-
119
-
120
-
121
-
122
-
123
-
124
-
125
-
126
-
127
-
128
-
129
-
130
-
131
-
132
-
133
-
 134
134 -
 135
135 -
 136
136 -
 137
137 -
 138
138 -
 139
139 -
 140
140 -
 141
141 -
 142
142 -
 143
143 -
 144
144 -
 145
145 -
 146
146 -
 147
147 -
 148
148 -
 149
149 -
 150
150 -
 151
151 -
 152
152
 |
 |

2009/10 Annual Report Lenovo Group Limited
142
NOTES TO THE FINANCIAL STATEMENTS (continued)
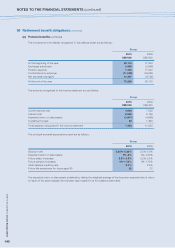
36 Retirement benefit obligations (continued)
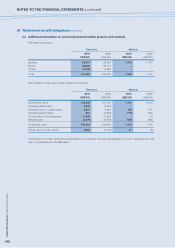
(c) Additional information on post-employment benefits (pension and medical)
Plan assets comprise:
Pensions Medical
2010 2009 2010 2009
US$’000 US$’000 US$’000 US$’000
Equities 25,901 36,245 7,618 7,761
Bonds 83,622 88,711 – –
Others 41,558 9,896 – –
Total 151,081 134,852 7,618 7,761
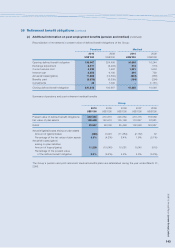
Reconciliation of fair value of plan assets of the Group:
Pensions Medical
2010 2009 2010 2009
US$’000 US$’000 US$’000 US$’000
Opening fair value 134,852 127,142 7,761 8,018
Exchange adjustment 6,209 (3,840) – –
Expected return on plan assets 3,947 4,066 196 217
Actuarial gains/(losses) 561 (5,800) (175) (223)
Contributions by the employer 11,088 19,823 – 13
Benefits paid (5,576) (6,539) (164) (264)
Closing fair value 151,081 134,852 7,618 7,761
Actual return on plan assets 4,594 (1,734) 21 (6)
Contributions of US$17,910,000 are estimated to be made for the year ending March 31, 2011, excluding amounts
due to be transferred from IBM plans.