Lenovo 2010 Annual Report Download - page 145
Download and view the complete annual report
Please find page 145 of the 2010 Lenovo annual report below. You can navigate through the pages in the report by either clicking on the pages listed below, or by using the keyword search tool below to find specific information within the annual report.-
 1
1 -
2
-
3
-
4
-
5
-
6
-
7
-
8
-
9
-
10
-
11
-
12
-
13
-
14
-
15
-
16
-
17
-
18
-
19
-
20
-
21
-
22
-
23
-
24
-
25
-
26
-
27
-
28
-
29
-
30
-
31
-
32
-
33
-
34
-
35
-
36
-
37
-
38
-
39
-
40
-
41
-
42
-
43
-
44
-
45
-
46
-
47
-
48
-
49
-
50
-
51
-
52
-
53
-
54
-
55
-
56
-
57
-
58
-
59
-
60
-
61
-
62
-
63
-
64
-
65
-
66
-
67
-
68
-
69
-
70
-
71
-
72
-
73
-
74
-
75
-
76
-
77
-
78
-
79
-
80
-
81
-
82
-
83
-
84
-
85
-
86
-
87
-
88
-
89
-
90
-
91
-
92
-
93
-
94
-
95
-
96
-
97
-
98
-
99
-
100
-
101
-
102
-
103
-
104
-
105
-
106
-
107
-
108
-
109
-
110
-
111
-
112
-
113
-
114
-
115
-
116
-
117
-
118
-
119
-
120
-
121
-
122
-
123
-
124
-
125
-
126
-
127
-
128
-
129
-
130
-
131
-
132
-
133
-
134
-
 135
135 -
 136
136 -
 137
137 -
 138
138 -
 139
139 -
 140
140 -
 141
141 -
 142
142 -
 143
143 -
 144
144 -
 145
145 -
 146
146 -
 147
147 -
 148
148 -
 149
149 -
 150
150 -
 151
151 -
 152
152
 |
 |

2009/10 Annual Report Lenovo Group Limited
143
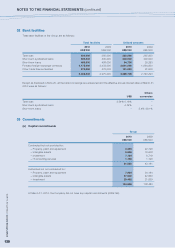
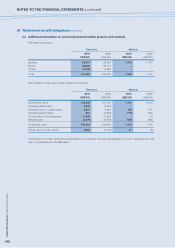
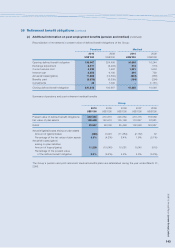
36 Retirement benefit obligations (continued)
(c) Additional information on post-employment benefits (pension and medical) (continued)
Reconciliation of movements in present value of defined benefit obligations of the Group:
Pensions Medical
2010 2009 2010 2009
US$’000 US$’000 US$’000 US$’000
Opening defined benefit obligation 193,967 204,406 16,646 16,244
Exchange adjustment 9,677 (6,406) 373 (116)
Current service cost 4,833 7,522 1,221 1,650
Interest cost 6,505 6,186 816 739
Actuarial losses/(gains) 11,868 (12,592) (642) (456)
Benefits paid (5,576) (6,539) (164) (264)
Curtailments 42 1,390 – (1,151)
Closing defined benefit obligation 221,316 193,967 18,250 16,646
Summary of pensions and post-retirement medical benefits
Group
2010 2009 2008 2007 2006
US$’000 US$’000 US$’000 US$’000 US$’000
Present value of defined benefit obligations 239,566 210,613 220,650 213,775 178,568
Fair value of plan assets 158,699 142,613 135,160 110,827 32,581
Deficit 80,867 68,000 85,490 102,948 145,987
Actuarial (gains)/losses arising on plan assets
Amount of (gains)/losses (386) 6,023 (11,384) (2,152) 32
Percentage of the fair value of plan assets 0.3% (4.2%) 8.4% 1.9% (0.1%)
Actuarial losses/(gains)
arising on plan liabilities
Amount of losses/(gains) 11,226 (13,048) 10,081 8,040 (510)
Percentage of the present value
of the defined benefit obligation 5.2% (6.2%) 4.6% 4.0% (0.3%)
The Group’s pension and post-retirement medical benefits plans are established during the year ended March 31,
2006.