Lenovo 2010 Annual Report Download - page 136
Download and view the complete annual report
Please find page 136 of the 2010 Lenovo annual report below. You can navigate through the pages in the report by either clicking on the pages listed below, or by using the keyword search tool below to find specific information within the annual report.-
 1
1 -
2
-
3
-
4
-
5
-
6
-
7
-
8
-
9
-
10
-
11
-
12
-
13
-
14
-
15
-
16
-
17
-
18
-
19
-
20
-
21
-
22
-
23
-
24
-
25
-
26
-
27
-
28
-
29
-
30
-
31
-
32
-
33
-
34
-
35
-
36
-
37
-
38
-
39
-
40
-
41
-
42
-
43
-
44
-
45
-
46
-
47
-
48
-
49
-
50
-
51
-
52
-
53
-
54
-
55
-
56
-
57
-
58
-
59
-
60
-
61
-
62
-
63
-
64
-
65
-
66
-
67
-
68
-
69
-
70
-
71
-
72
-
73
-
74
-
75
-
76
-
77
-
78
-
79
-
80
-
81
-
82
-
83
-
84
-
85
-
86
-
87
-
88
-
89
-
90
-
91
-
92
-
93
-
94
-
95
-
96
-
97
-
98
-
99
-
100
-
101
-
102
-
103
-
104
-
105
-
106
-
107
-
108
-
109
-
110
-
111
-
112
-
113
-
114
-
115
-
116
-
117
-
118
-
119
-
120
-
121
-
122
-
123
-
124
-
125
-
 126
126 -
 127
127 -
 128
128 -
 129
129 -
 130
130 -
 131
131 -
 132
132 -
 133
133 -
 134
134 -
 135
135 -
 136
136 -
 137
137 -
 138
138 -
 139
139 -
 140
140 -
 141
141 -
 142
142 -
 143
143 -
 144
144 -
 145
145 -
 146
146 -
147
-
148
-
149
-
150
-
151
-
152
 |
 |

2009/10 Annual Report Lenovo Group Limited
134
NOTES TO THE FINANCIAL STATEMENTS (continued)
134
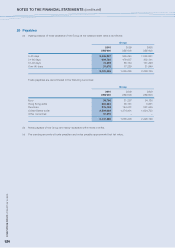
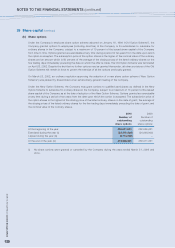
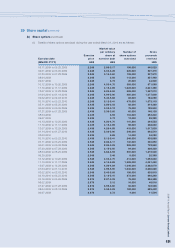
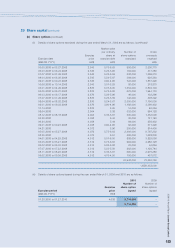
29 Share capital (continued)
(b) Share options (continued)
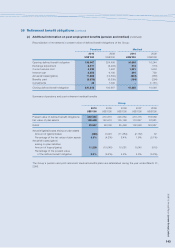
(iv) Details of outstanding share options at the balance sheet date were as follows:
2010 2009
Number of Number of
Exercise outstanding outstanding
Exercise period price share options share options
(MM.DD.YYYY) HK$
Old Option Scheme
01.28.2000 to 01.27.2010 4.038 – 6,510,000
01.15.2001 to 01.14.2011 4.312 47,887,000 52,050,000
04.16.2001 to 04.15.2011 4.072 18,524,000 27,816,000
08.31.2001 to 08.30.2011 2.876 31,972,000 38,502,000
98,383,000 124,878,000
New Option Scheme
10.10.2002 to 10.09.2012 2.435 18,374,500 19,982,000
04.26.2003 to 04.25.2013 2.245 33,252,000 37,660,000
04.27.2004 to 04.26.2014 2.545 69,917,051 75,491,051
121,543,551 133,133,051
219,926,551 258,011,051
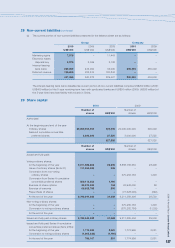
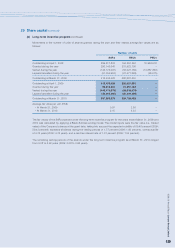
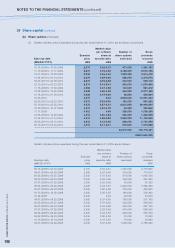
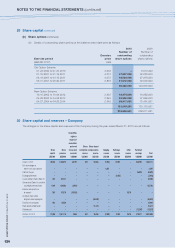
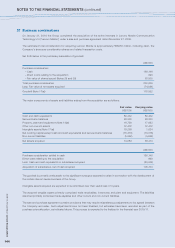
30 Share capital and reserves – Company
The changes in the share capital and reserves of the Company during the year ended March 31, 2010 are as follows:
Convertible
rights in
respect of
convertible
preferred Share Share-based
Share Share shares and redemption compensation Hedging Exchange Other Retained
capital premium warrants reserve reserve reserve reserve reserve earnings Total
US$’000 US$’000 US$’000 US$’000 US$’000 US$’000 US$’000 US$’000 US$’000 US$’000
At April 1, 2009 29,530 1,106,379 42,159 497 92,684 (7,765) 12,925 – 545,702 1,822,111
Fair value change on
interest rate swap contracts – – – – – 4,367 – – – 4,367
Profit for the year – – – – – – – – 36,876 36,876
Exchange differences – – – – – – (3,403) – – (3,403)
Issue of ordinary shares (Note 37) 359 63,141 – – – – – – – 63,500
Conversion of Series A cumulative
convertible preferred shares 1,190 126,484 (3,970) – – – – – – 123,704
Exercise and repurchase
of warrants 205 31,578 (35,353) – – – – 3,570 – –
Vesting of shares under
long-term inventive program – – – – (68,043) – – – – (68,043)
Exercise of share options 104 13,536 – – – – – – – 13,640
Share-based compensation – – – – 51,413 – – – – 51,413
Dividend paid – – – – – – – – (12,267) (12,267)
At March 31, 2010 31,388 1,341,118 2,836 497 76,054 (3,398) 9,522 3,570 570,311 2,031,898