Lenovo 2010 Annual Report Download - page 127
Download and view the complete annual report
Please find page 127 of the 2010 Lenovo annual report below. You can navigate through the pages in the report by either clicking on the pages listed below, or by using the keyword search tool below to find specific information within the annual report.-
 1
1 -
2
-
3
-
4
-
5
-
6
-
7
-
8
-
9
-
10
-
11
-
12
-
13
-
14
-
15
-
16
-
17
-
18
-
19
-
20
-
21
-
22
-
23
-
24
-
25
-
26
-
27
-
28
-
29
-
30
-
31
-
32
-
33
-
34
-
35
-
36
-
37
-
38
-
39
-
40
-
41
-
42
-
43
-
44
-
45
-
46
-
47
-
48
-
49
-
50
-
51
-
52
-
53
-
54
-
55
-
56
-
57
-
58
-
59
-
60
-
61
-
62
-
63
-
64
-
65
-
66
-
67
-
68
-
69
-
70
-
71
-
72
-
73
-
74
-
75
-
76
-
77
-
78
-
79
-
80
-
81
-
82
-
83
-
84
-
85
-
86
-
87
-
88
-
89
-
90
-
91
-
92
-
93
-
94
-
95
-
96
-
97
-
98
-
99
-
100
-
101
-
102
-
103
-
104
-
105
-
106
-
107
-
108
-
109
-
110
-
111
-
112
-
113
-
114
-
115
-
116
-
 117
117 -
 118
118 -
 119
119 -
 120
120 -
 121
121 -
 122
122 -
 123
123 -
 124
124 -
 125
125 -
 126
126 -
 127
127 -
 128
128 -
 129
129 -
 130
130 -
 131
131 -
 132
132 -
 133
133 -
 134
134 -
 135
135 -
 136
136 -
 137
137 -
138
-
139
-
140
-
141
-
142
-
143
-
144
-
145
-
146
-
147
-
148
-
149
-
150
-
151
-
152
 |
 |

2009/10 Annual Report Lenovo Group Limited
125125
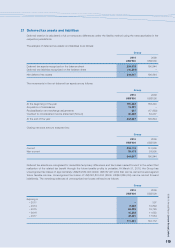
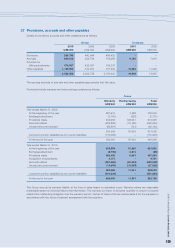
27 Provisions, accruals and other payables
Details of provisions, accruals and other payables are as follows:
Group Company
2010 2009 2008 2010 2009
US$’000 US$’000 US$’000 US$’000 US$’000
Provisions 260,796 460,994 496,432 – –
Accruals 659,212 524,746 742,269 9,765 7,916
Provision for
billing adjustments 474,937 426,081 159,276 – –
Other payables 1,190,905 610,937 761,445 10,083 11,029
2,585,850 2,022,758 2,159,422 19,848 18,945
The carrying amounts of accruals and other payables approximate their fair value.
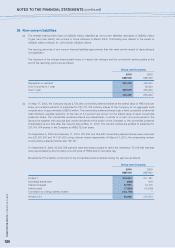
Provisions include warranty and restructuring provisions as follows:
Group
Warranty Restructuring Total
US$’000 US$’000 US$’000
Year ended March 31, 2009
At the beginning of the year 697,915 7,588 705,503
Exchange adjustment (2,191) (520) (2,711)
Provisions made 404,564 108,041 512,605
Amounts utilized (483,898) (16,755) (500,653)
Unused amounts reversed (82,991) (751) (83,742)
533,399 97,603 631,002
Long-term portion classified as non-current liabilities (170,008) – (170,008)
At the end of the year 363,391 97,603 460,994
Year ended March 31, 2010
At the beginning of the year 533,399 97,603 631,002
Exchange adjustment (2,739) 2,673 (66)
Provisions made 480,402 6,631 487,033
Acquisition of subsidiaries 4,701 – 4,701
Amounts utilized (451,065) (81,943) (533,008)
Unused amounts reversed (14,009) (13,623) (27,632)
550,689 11,341 562,030
Long-term portion classified as non-current liabilities (301,234) – (301,234)
At the end of the year 249,455 11,341 260,796
The Group records its warranty liability at the time of sales based on estimated costs. Warranty claims are reasonably
predictable based on historical failure rate information. The warranty provision is reviewed quarterly to ensure it properly
reflects the outstanding obligation over the warranty period. Certain of these costs are reimbursable from the suppliers in
accordance with the terms of relevant arrangement with the suppliers.