Lenovo 2010 Annual Report Download - page 25
Download and view the complete annual report
Please find page 25 of the 2010 Lenovo annual report below. You can navigate through the pages in the report by either clicking on the pages listed below, or by using the keyword search tool below to find specific information within the annual report.-
 1
1 -
2
-
3
-
4
-
5
-
6
-
7
-
8
-
9
-
10
-
11
-
12
-
13
-
14
-
 15
15 -
 16
16 -
 17
17 -
 18
18 -
 19
19 -
 20
20 -
 21
21 -
 22
22 -
 23
23 -
 24
24 -
 25
25 -
 26
26 -
 27
27 -
 28
28 -
 29
29 -
 30
30 -
 31
31 -
 32
32 -
 33
33 -
 34
34 -
 35
35 -
36
-
37
-
38
-
39
-
40
-
41
-
42
-
43
-
44
-
45
-
46
-
47
-
48
-
49
-
50
-
51
-
52
-
53
-
54
-
55
-
56
-
57
-
58
-
59
-
60
-
61
-
62
-
63
-
64
-
65
-
66
-
67
-
68
-
69
-
70
-
71
-
72
-
73
-
74
-
75
-
76
-
77
-
78
-
79
-
80
-
81
-
82
-
83
-
84
-
85
-
86
-
87
-
88
-
89
-
90
-
91
-
92
-
93
-
94
-
95
-
96
-
97
-
98
-
99
-
100
-
101
-
102
-
103
-
104
-
105
-
106
-
107
-
108
-
109
-
110
-
111
-
112
-
113
-
114
-
115
-
116
-
117
-
118
-
119
-
120
-
121
-
122
-
123
-
124
-
125
-
126
-
127
-
128
-
129
-
130
-
131
-
132
-
133
-
134
-
135
-
136
-
137
-
138
-
139
-
140
-
141
-
142
-
143
-
144
-
145
-
146
-
147
-
148
-
149
-
150
-
151
-
152
 |
 |

2009/10 Annual Report Lenovo Group Limited
23
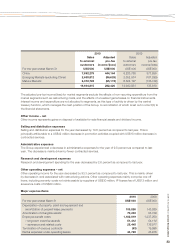
2010 2009
Sales Adjusted Sales Adjusted
to external pre-tax to external pre-tax
customers income/(loss) customers income/(loss)
For the year ended March 31 US$’000 US$’000 US$’000 US$’000
China 7,892,275 444,164 6,223,760 377,858
Emerging Markets (excluding China) 2,639,812 (96,625) 2,352,974 (107,299)
Mature Markets 6,072,728 (65,119) 6,324,197 (136,749)
16,604,815 282,420 14,900,931 133,810
The adjusted pre-tax income/(loss) for market segments exclude the effects of non-recurring expenditure from the
market segments such as restructuring costs, and the effects of unrealized gains/losses on financial instruments.
Interest income and expenditure are not allocated to segments, as this type of activity is driven by the central
treasury function, which manages the cash position of the Group. A reconciliation of which is set out in note 5(b) to
the financial statements.
Other income – net
Other income represents gains on disposal of available-for-sale financial assets and dividend income.
Selling and distribution expenses
Selling and distribution expenses for the year decreased by 10.6 percent as compared to last year. This is
principally attributable to a US$42 million decrease in promotion activities coupled with US$18 million decrease in
contracted services.
Administrative expenses
The Group experienced a decrease in administrative expenses for the year of 9.8 percent as compared to last
year. The decrease is mainly driven by fewer contracted services.
Research and development expenses
Research and development spending for the year decreased by 2.6 percent as compared to last year.
Other operating expenses – net
Other operating income for the year decreased by 83.3 percent as compared to last year. This is mainly driven
by decrease in cost associated with restructuring actions. Other operating expenses mainly comprise one-off
items, including warranty costs not reimbursable by suppliers of US$30 million, IP license fee of US$12 million and
severance costs of US$20 million.
Major expense items
2010 2009
For the year ended Mach 31 US$’000 US$’000
Depreciation of property, plant and equipment and
amortization of prepaid lease payments 100,826 143,269
Amortization of intangible assets 70,202 83,729
Employee benefit costs 1,182,019 1,237,250
– long-term incentive awards 51,412 54,114
– severance and related costs 25,448 116,077
Termination of onerous contracts (63) 19,996
Rental expenses under operating leases 44,729 45,976