Lenovo 2010 Annual Report Download - page 142
Download and view the complete annual report
Please find page 142 of the 2010 Lenovo annual report below. You can navigate through the pages in the report by either clicking on the pages listed below, or by using the keyword search tool below to find specific information within the annual report.-
 1
1 -
2
-
3
-
4
-
5
-
6
-
7
-
8
-
9
-
10
-
11
-
12
-
13
-
14
-
15
-
16
-
17
-
18
-
19
-
20
-
21
-
22
-
23
-
24
-
25
-
26
-
27
-
28
-
29
-
30
-
31
-
32
-
33
-
34
-
35
-
36
-
37
-
38
-
39
-
40
-
41
-
42
-
43
-
44
-
45
-
46
-
47
-
48
-
49
-
50
-
51
-
52
-
53
-
54
-
55
-
56
-
57
-
58
-
59
-
60
-
61
-
62
-
63
-
64
-
65
-
66
-
67
-
68
-
69
-
70
-
71
-
72
-
73
-
74
-
75
-
76
-
77
-
78
-
79
-
80
-
81
-
82
-
83
-
84
-
85
-
86
-
87
-
88
-
89
-
90
-
91
-
92
-
93
-
94
-
95
-
96
-
97
-
98
-
99
-
100
-
101
-
102
-
103
-
104
-
105
-
106
-
107
-
108
-
109
-
110
-
111
-
112
-
113
-
114
-
115
-
116
-
117
-
118
-
119
-
120
-
121
-
122
-
123
-
124
-
125
-
126
-
127
-
128
-
129
-
130
-
131
-
 132
132 -
 133
133 -
 134
134 -
 135
135 -
 136
136 -
 137
137 -
 138
138 -
 139
139 -
 140
140 -
 141
141 -
 142
142 -
 143
143 -
 144
144 -
 145
145 -
 146
146 -
 147
147 -
 148
148 -
 149
149 -
 150
150 -
 151
151 -
 152
152
 |
 |

2009/10 Annual Report Lenovo Group Limited
140
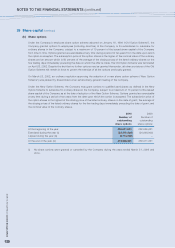
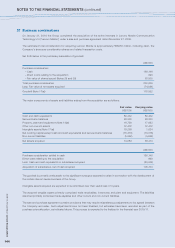
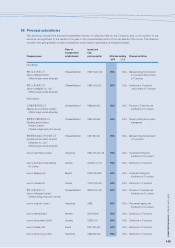
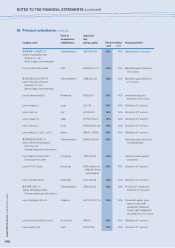
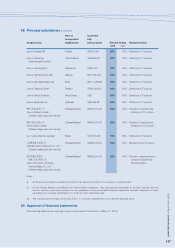
NOTES TO THE FINANCIAL STATEMENTS (continued)
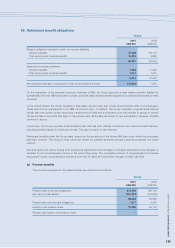
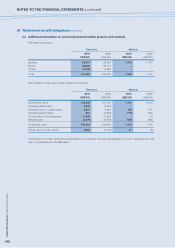
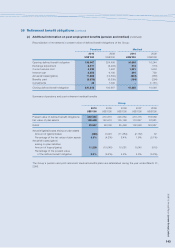
36 Retirement benefit obligations (continued)
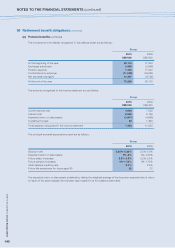
(a) Pension benefits (continued)
The movements in the liability recognized in the balance sheet are as follows:
Group
2010 2009
US$’000 US$’000
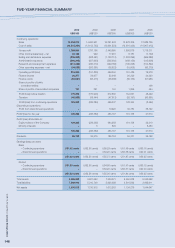
At the beginning of the year 59,115 77,264
Exchange adjustment 3,468 (2,566)
Pension expense 7,433 11,032
Contributions by employer (11,088) (19,823)
Net actuarial loss/(gain) 11,307 (6,792)
At the end of the year 70,235 59,115
The amounts recognized in the income statement are as follows:
Group
2010 2009
US$’000 US$’000
Current service cost 4,833 7,522
Interest cost 6,505 6,186
Expected return on plan assets (3,947) (4,066)
Curtailment losses 42 1,390
Total expense recognized in the income statement 7,433 11,032
The principal actuarial assumptions used are as follows:
Group
2010 2009
Discount rate 2.25%-5.25% 2.5%-5.5%
Expected return on plan assets 0%-5% 0%-4.25%
Future salary increases 2.2%-3.5% 2.2%-3.5%
Future pension increases 0%-1.75% 0%-1.75%
Cash balance crediting rate 2.5% 2.5%
Future life expectancy for those aged 60 22 22
The expected return on plan assets is derived by taking the weighted average of the long term expected rate of return
on each of the asset classes that the plan was invested in at the balance sheet date.