Lenovo 2010 Annual Report Download - page 95
Download and view the complete annual report
Please find page 95 of the 2010 Lenovo annual report below. You can navigate through the pages in the report by either clicking on the pages listed below, or by using the keyword search tool below to find specific information within the annual report.-
 1
1 -
2
-
3
-
4
-
5
-
6
-
7
-
8
-
9
-
10
-
11
-
12
-
13
-
14
-
15
-
16
-
17
-
18
-
19
-
20
-
21
-
22
-
23
-
24
-
25
-
26
-
27
-
28
-
29
-
30
-
31
-
32
-
33
-
34
-
35
-
36
-
37
-
38
-
39
-
40
-
41
-
42
-
43
-
44
-
45
-
46
-
47
-
48
-
49
-
50
-
51
-
52
-
53
-
54
-
55
-
56
-
57
-
58
-
59
-
60
-
61
-
62
-
63
-
64
-
65
-
66
-
67
-
68
-
69
-
70
-
71
-
72
-
73
-
74
-
75
-
76
-
77
-
78
-
79
-
80
-
81
-
82
-
83
-
84
-
 85
85 -
 86
86 -
 87
87 -
 88
88 -
 89
89 -
 90
90 -
 91
91 -
 92
92 -
 93
93 -
 94
94 -
 95
95 -
 96
96 -
 97
97 -
 98
98 -
 99
99 -
 100
100 -
 101
101 -
 102
102 -
 103
103 -
 104
104 -
 105
105 -
106
-
107
-
108
-
109
-
110
-
111
-
112
-
113
-
114
-
115
-
116
-
117
-
118
-
119
-
120
-
121
-
122
-
123
-
124
-
125
-
126
-
127
-
128
-
129
-
130
-
131
-
132
-
133
-
134
-
135
-
136
-
137
-
138
-
139
-
140
-
141
-
142
-
143
-
144
-
145
-
146
-
147
-
148
-
149
-
150
-
151
-
152
 |
 |

2009/10 Annual Report Lenovo Group Limited
93
2009/10 Annual Report Lenovo Group Limited
93
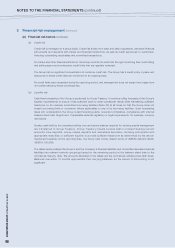
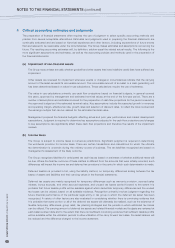
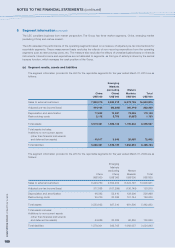
3 Financial risk management (continued)
(a) Financial risk factors (continued)
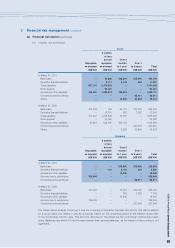
(iv) Liquidity risk (continued)
Group
3 months
or less
but not Over 3
Repayable repayable months Over 1
on demand on demand to 1 year to 5 years Total
US$’000 US$’000 US$’000 US$’000 US$’000
At March 31, 2010
Bank loans – 30,888 263,818 200,000 494,706
Derivative financial liabilities – 8,117 3,142 248 11,507
Trade payables 667,781 2,473,645 – – 3,141,426
Notes payable – 94,427 – – 94,427
Accrual and other payables 360,020 1,293,273 196,824 – 1,850,117
Convertible preferred shares – – – 98,611 98,611
Others – – 10,550 24,863 35,413
At March 31, 2009
Bank loans 400,000 159 55,134 230,000 685,293
Derivative financial liabilities – 23,291 383 7,382 31,056
Trade payables 371,607 1,228,596 35,087 – 1,635,290
Notes payable – 34,180 – – 34,180
Accrual and other payables 46,891 623,690 465,102 – 1,135,683
Convertible preferred shares – – – 227,564 227,564
Others – – 2,359 33,864 36,223
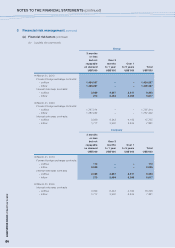
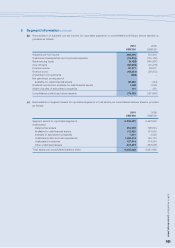
Company
3 months
or less
but not Over 3
Repayable repayable months Over 1
on demand on demand to 1 year to 5 years Total
US$’000 US$’000 US$’000 US$’000 US$’000
At March 31, 2010
Bank loans – – 230,000 200,000 430,000
Derivative financial liabilities – 110 3,142 248 3,500
Accrual and other payables – – 19,848 – 19,848
Amounts due to subsidiaries 526,686 – – – 526,686
Convertible preferred shares – – – 98,611 98,611
At March 31, 2009
Bank loans 400,000 – 35,000 230,000 665,000
Derivative financial liabilities – – 383 7,382 7,765
Accrual and other payables – – 18,945 – 18,945
Amounts due to subsidiaries 329,039 – – – 329,039
Convertible preferred shares – – – 227,564 227,564
The tables below analyze the Group’s and the Company’s derivative financial instruments that will be settled
on a gross basis into relevant maturity groupings based on the remaining period at the balance sheet date
to the contractual maturity date. The amounts disclosed in the tables are the contractual undiscounted cash
flows. Balances due within 12 months approximate their carrying balances, as the impact of discounting is not
significant.