Lenovo 2010 Annual Report Download - page 135
Download and view the complete annual report
Please find page 135 of the 2010 Lenovo annual report below. You can navigate through the pages in the report by either clicking on the pages listed below, or by using the keyword search tool below to find specific information within the annual report.-
 1
1 -
2
-
3
-
4
-
5
-
6
-
7
-
8
-
9
-
10
-
11
-
12
-
13
-
14
-
15
-
16
-
17
-
18
-
19
-
20
-
21
-
22
-
23
-
24
-
25
-
26
-
27
-
28
-
29
-
30
-
31
-
32
-
33
-
34
-
35
-
36
-
37
-
38
-
39
-
40
-
41
-
42
-
43
-
44
-
45
-
46
-
47
-
48
-
49
-
50
-
51
-
52
-
53
-
54
-
55
-
56
-
57
-
58
-
59
-
60
-
61
-
62
-
63
-
64
-
65
-
66
-
67
-
68
-
69
-
70
-
71
-
72
-
73
-
74
-
75
-
76
-
77
-
78
-
79
-
80
-
81
-
82
-
83
-
84
-
85
-
86
-
87
-
88
-
89
-
90
-
91
-
92
-
93
-
94
-
95
-
96
-
97
-
98
-
99
-
100
-
101
-
102
-
103
-
104
-
105
-
106
-
107
-
108
-
109
-
110
-
111
-
112
-
113
-
114
-
115
-
116
-
117
-
118
-
119
-
120
-
121
-
122
-
123
-
124
-
 125
125 -
 126
126 -
 127
127 -
 128
128 -
 129
129 -
 130
130 -
 131
131 -
 132
132 -
 133
133 -
 134
134 -
 135
135 -
 136
136 -
 137
137 -
 138
138 -
 139
139 -
 140
140 -
 141
141 -
 142
142 -
 143
143 -
 144
144 -
 145
145 -
146
-
147
-
148
-
149
-
150
-
151
-
152
 |
 |

2009/10 Annual Report Lenovo Group Limited
133133
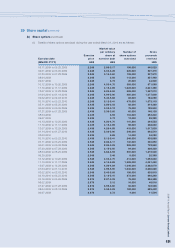
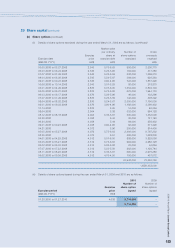
29 Share capital (continued)
(b) Share options (continued)
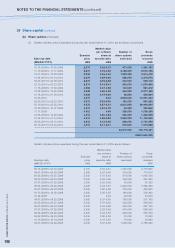
(ii) Details of share options exercised during the year ended March 31, 2009 are as follows: (continued)
Market value
per ordinary Number of Gross
Exercise share at share options proceeds
Exercise date price exercise date exercised received
(MM.DD.YYYY) HK$ HK$ HK$
05.05.2008 to 05.27.2008 2.545 5.75-6.63 906,000 2,305,770
06.03.2008 to 06.24.2008 2.545 5.26-5.96 164,000 417,380
07.07.2008 to 07.29.2008 2.545 5.23-5.59 538,000 1,369,210
08.04.2008 to 08.26.2008 2.545 5.24-5.67 364,000 926,380
09.01.2008 to 09.23.2008 2.545 3.90-4.96 722,000 1,837,490
10.06.2008 to 10.14.2008 2.545 3.01-3.29 86,000 218,870
04.01.2008 to 04.29.2008 2.876 5.07-6.00 1,354,000 3,894,104
05.05.2008 to 05.27.2008 2.876 5.75-6.63 676,000 1,944,176
06.03.2008 to 06.17.2008 2.876 5.26-5.96 46,000 132,296
07.07.2008 to 07.29.2008 2.876 5.23-5.59 142,000 408,392
08.04.2008 to 08.26.2008 2.876 5.24-5.67 2,500,000 7,190,000
09.01.2008 to 09.23.2008 2.876 3.90-4.96 1,182,000 3,399,432
10.14.2008 2.876 3.25 14,000 40,264
08.04.2008 2.904 5.38 332,000 964,128
08.12.2008 to 08.18.2008 2.904 5.36-5.67 500,000 1,452,000
05.20.2008 4.038 6.44 30,000 121,140
06.24.2008 4.038 5.44 64,000 258,432
09.01.2008 to 09.23.2008 4.038 3.90-4.96 92,000 371,496
04.21.2008 4.072 5.96 200,000 814,400
05.05.2008 to 05.27.2008 4.072 5.75-6.63 2,406,000 9,797,232
08.25.2008 4.072 5.57 400,000 1,628,800
04.01.2008 to 04.29.2008 4.312 5.07-6.00 888,000 3,829,056
05.05.2008 to 05.27.2008 4.312 5.75-6.63 994,000 4,286,128
06.02.2008 to 06.03.2008 4.312 5.83-5.88 22,000 94,864
07.07.2008 to 07.22.2008 4.312 5.23-5.59 262,000 1,129,744
08.11.2008 to 08.26.2008 4.312 5.36-5.67 690,000 2,975,280
09.02.2008 to 09.09.2008 4.312 4.70-4.95 106,000 457,072
24,948,000 73,552,736
US$9,433,000
(iii) Details of share options lapsed during the year ended March 31, 2009 and 2010 are as follows:
2010 2009
Number of Number of
Exercise share option share options
Exercise period price lapsed lapsed
(MM.DD.YYYY) HK$
01.28.2000 to 01.27.2010 4.038 5,714,000 –
5,714,000 –