Lenovo 2010 Annual Report Download - page 74
Download and view the complete annual report
Please find page 74 of the 2010 Lenovo annual report below. You can navigate through the pages in the report by either clicking on the pages listed below, or by using the keyword search tool below to find specific information within the annual report.-
 1
1 -
2
-
3
-
4
-
5
-
6
-
7
-
8
-
9
-
10
-
11
-
12
-
13
-
14
-
15
-
16
-
17
-
18
-
19
-
20
-
21
-
22
-
23
-
24
-
25
-
26
-
27
-
28
-
29
-
30
-
31
-
32
-
33
-
34
-
35
-
36
-
37
-
38
-
39
-
40
-
41
-
42
-
43
-
44
-
45
-
46
-
47
-
48
-
49
-
50
-
51
-
52
-
53
-
54
-
55
-
56
-
57
-
58
-
59
-
60
-
61
-
62
-
63
-
 64
64 -
 65
65 -
 66
66 -
 67
67 -
 68
68 -
 69
69 -
 70
70 -
 71
71 -
 72
72 -
 73
73 -
 74
74 -
 75
75 -
 76
76 -
 77
77 -
 78
78 -
 79
79 -
 80
80 -
 81
81 -
 82
82 -
 83
83 -
 84
84 -
85
-
86
-
87
-
88
-
89
-
90
-
91
-
92
-
93
-
94
-
95
-
96
-
97
-
98
-
99
-
100
-
101
-
102
-
103
-
104
-
105
-
106
-
107
-
108
-
109
-
110
-
111
-
112
-
113
-
114
-
115
-
116
-
117
-
118
-
119
-
120
-
121
-
122
-
123
-
124
-
125
-
126
-
127
-
128
-
129
-
130
-
131
-
132
-
133
-
134
-
135
-
136
-
137
-
138
-
139
-
140
-
141
-
142
-
143
-
144
-
145
-
146
-
147
-
148
-
149
-
150
-
151
-
152
 |
 |

2009/10 Annual Report Lenovo Group Limited
72
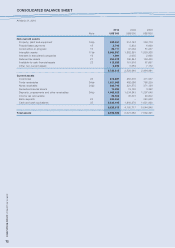
CONSOLIDATED BALANCE SHEET
At March 31, 2010
2010 2009 2008
Note US$’000 US$’000 US$’000
Non-current assets
Property, plant and equipment 14(a) 248,261 314,142 364,778
Prepaid lease payments 15 3,748 5,833 6,099
Construction-in-progress 16 24,711 47,062 51,237
Intangible assets 17(a) 2,066,337 1,852,861 1,838,368
Interests in associated companies 19 1,061 2,635 2,690
Deferred tax assets 21 254,978 190,844 156,440
Available-for-sale financial assets 22 112,520 101,916 67,697
Other non-current assets 8,699 5,653 7,172
2,720,315 2,520,946 2,494,481
Current assets
Inventories 23 878,887 450,370 471,557
Trade receivables 24(a) 1,021,062 482,086 760,239
Notes receivable 24(b) 386,746 221,575 371,126
Derivative financial assets 13,283 13,163 3,392
Deposits, prepayments and other receivables 24(c) 1,463,422 1,034,843 1,207,046
Income tax recoverable 33,562 35,301 40,002
Bank deposits 25 200,456 – 540,058
Cash and cash equivalents 25 2,238,195 1,863,379 1,651,420
6,235,613 4,100,717 5,044,840
Total assets 8,955,928 6,621,663 7,539,321