Lenovo 2010 Annual Report Download - page 117
Download and view the complete annual report
Please find page 117 of the 2010 Lenovo annual report below. You can navigate through the pages in the report by either clicking on the pages listed below, or by using the keyword search tool below to find specific information within the annual report.-
 1
1 -
2
-
3
-
4
-
5
-
6
-
7
-
8
-
9
-
10
-
11
-
12
-
13
-
14
-
15
-
16
-
17
-
18
-
19
-
20
-
21
-
22
-
23
-
24
-
25
-
26
-
27
-
28
-
29
-
30
-
31
-
32
-
33
-
34
-
35
-
36
-
37
-
38
-
39
-
40
-
41
-
42
-
43
-
44
-
45
-
46
-
47
-
48
-
49
-
50
-
51
-
52
-
53
-
54
-
55
-
56
-
57
-
58
-
59
-
60
-
61
-
62
-
63
-
64
-
65
-
66
-
67
-
68
-
69
-
70
-
71
-
72
-
73
-
74
-
75
-
76
-
77
-
78
-
79
-
80
-
81
-
82
-
83
-
84
-
85
-
86
-
87
-
88
-
89
-
90
-
91
-
92
-
93
-
94
-
95
-
96
-
97
-
98
-
99
-
100
-
101
-
102
-
103
-
104
-
105
-
106
-
 107
107 -
 108
108 -
 109
109 -
 110
110 -
 111
111 -
 112
112 -
 113
113 -
 114
114 -
 115
115 -
 116
116 -
 117
117 -
 118
118 -
 119
119 -
 120
120 -
 121
121 -
 122
122 -
 123
123 -
 124
124 -
 125
125 -
 126
126 -
 127
127 -
128
-
129
-
130
-
131
-
132
-
133
-
134
-
135
-
136
-
137
-
138
-
139
-
140
-
141
-
142
-
143
-
144
-
145
-
146
-
147
-
148
-
149
-
150
-
151
-
152
 |
 |

2009/10 Annual Report Lenovo Group Limited
115115
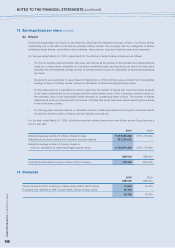
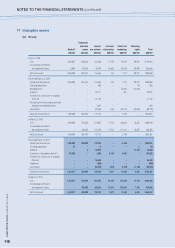
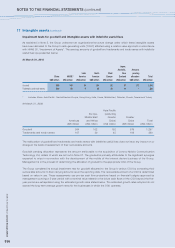
17 Intangible assets (continued)
Impairment tests for goodwill and intangible assets with indefinite useful lives (continued)
The estimated growth rates used for value-in-use calculations in 2010 are as follows:
Japan,
Australia,
Latin North West New
China HARIE America America Europe Zealand
Growth rate 13.9% 9.7% 2.3% 4.3% 0.2% (3.2%)
The estimated growth rates used for value-in-use calculations in 2009 are as follows:
Asia Pacific
Europe, (excluding
Middle East Greater Greater
Americas and Africa China) China
Growth rate 1.6% 2.8% 1.4% 9%
Future cash flows are discounted at the standard rate of 11% (2009: 11%) across all CGUs.
Management determined budgeted gross margins based on past performance and its expectations for the market
development. The weighted average growth rates used are consistent with the forecasts included in industry reports. The
discount rates are pre-tax and reflect specific risks relating to the relevant segments.
The directors are of the view that there was no evidence of impairment of goodwill and trademarks and trade names as at
March 31, 2010 arising from the review (2009: Nil).
If the discount rate had been one percentage point higher than management’s estimates (from 11% to 12%), the Group
would have recognized an impairment against goodwill of US$8 million. If the growth rates had been one percentage point
lower than management’s estimates, the Group would have recognized an impairment against goodwill of US$3 million.
If the forecasted operating margins had been one-fifth percentage point lower than management’s estimates, the Group
would have recognized an impairment against goodwill of US$15 million.
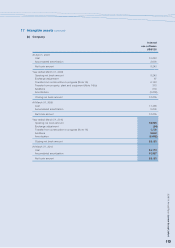
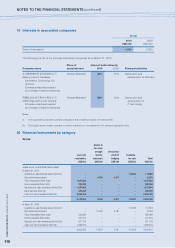
18 Subsidiaries
(a) Investments in subsidiaries
Company
2010 2009
US$’000 US$’000
Unlisted investments, at cost 1,898,912 1,860,176
A summary of the principal subsidiaries of the Company is set out in Note 38.
(b) Amounts due from/(to) subsidiaries
The amounts are interest-free, unsecured and have no fixed terms of repayment.
The carrying amounts of amounts due from subsidiaries approximate their fair value which are also the maximum
exposure to credit risk at the balance sheet date.