Lenovo 2010 Annual Report Download - page 124
Download and view the complete annual report
Please find page 124 of the 2010 Lenovo annual report below. You can navigate through the pages in the report by either clicking on the pages listed below, or by using the keyword search tool below to find specific information within the annual report.-
 1
1 -
2
-
3
-
4
-
5
-
6
-
7
-
8
-
9
-
10
-
11
-
12
-
13
-
14
-
15
-
16
-
17
-
18
-
19
-
20
-
21
-
22
-
23
-
24
-
25
-
26
-
27
-
28
-
29
-
30
-
31
-
32
-
33
-
34
-
35
-
36
-
37
-
38
-
39
-
40
-
41
-
42
-
43
-
44
-
45
-
46
-
47
-
48
-
49
-
50
-
51
-
52
-
53
-
54
-
55
-
56
-
57
-
58
-
59
-
60
-
61
-
62
-
63
-
64
-
65
-
66
-
67
-
68
-
69
-
70
-
71
-
72
-
73
-
74
-
75
-
76
-
77
-
78
-
79
-
80
-
81
-
82
-
83
-
84
-
85
-
86
-
87
-
88
-
89
-
90
-
91
-
92
-
93
-
94
-
95
-
96
-
97
-
98
-
99
-
100
-
101
-
102
-
103
-
104
-
105
-
106
-
107
-
108
-
109
-
110
-
111
-
112
-
113
-
 114
114 -
 115
115 -
 116
116 -
 117
117 -
 118
118 -
 119
119 -
 120
120 -
 121
121 -
 122
122 -
 123
123 -
 124
124 -
 125
125 -
 126
126 -
 127
127 -
 128
128 -
 129
129 -
 130
130 -
 131
131 -
 132
132 -
 133
133 -
 134
134 -
135
-
136
-
137
-
138
-
139
-
140
-
141
-
142
-
143
-
144
-
145
-
146
-
147
-
148
-
149
-
150
-
151
-
152
 |
 |

2009/10 Annual Report Lenovo Group Limited
122
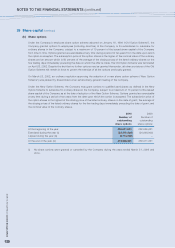
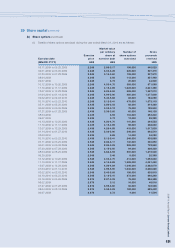
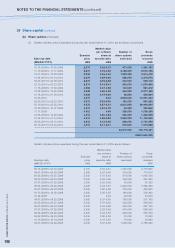
NOTES TO THE FINANCIAL STATEMENTS (continued)
122
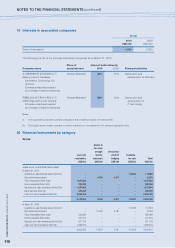
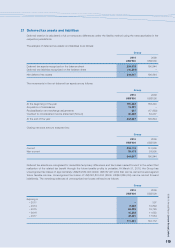
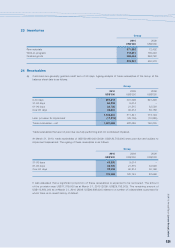
24 Receivables (continued)
(a) (continued)
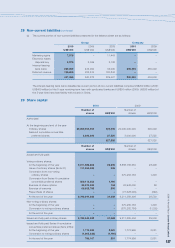
Movements on the provision for impairment of trade receivables are as follows:
Group
2010 2009 2008
US$’000 US$’000 US$’000
At the beginning of the year 29,755 13,885 23,939
Exchange adjustment 296 168 –
Provisions made 14,702 24,631 –
Receivables written off during
the year as uncollectible (22,434) (7,400) (8,167)
Unused amounts reversed (5,000) (1,529) (597)
Disposal of discontinued operations – – (1,290)
At the end of the year 17,319 29,755 13,885
(b) Notes receivable of the Group are bank accepted notes mainly with maturity dates of within six months.
(c) Details of deposits, prepayments and other receivables are as follows:
Group Company
2010 2009 2008 2010 2009
US$’000 US$’000 US$’000 US$’000 US$’000
Deposits 553 3,466 2,640 881 212
Prepayments 175,528 197,050 182,534 5,017 67
Other receivables 1,287,341 834,327 1,021,872 – 317
1,463,422 1,034,843 1,207,046 5,898 596
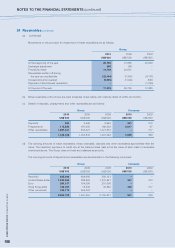
(d) The carrying amounts of trade receivables, notes receivable, deposits and other receivables approximate their fair
value. The maximum exposure to credit risk at the balance sheet date is the fair value of each class of receivable
mentioned above. The Group does not hold any collateral as security.
The carrying amounts of deposits and receivables are denominated in the following currencies:
Group Company
2010 2009 2008 2010 2009
US$’000 US$’000 US$’000 US$’000 US$’000
Renminbi 625,006 488,692 593,121 – –
United States dollar 1,532,052 288,806 1,275,841 531 312
Euro 250,017 194,396 251,095 – –
Hong Kong dollar 105,457 15,236 35,820 350 217
Other currencies 183,170 554,324 – – –
2,695,702 1,541,454 2,155,877 881 529