Lenovo 2010 Annual Report Download - page 78
Download and view the complete annual report
Please find page 78 of the 2010 Lenovo annual report below. You can navigate through the pages in the report by either clicking on the pages listed below, or by using the keyword search tool below to find specific information within the annual report.-
 1
1 -
2
-
3
-
4
-
5
-
6
-
7
-
8
-
9
-
10
-
11
-
12
-
13
-
14
-
15
-
16
-
17
-
18
-
19
-
20
-
21
-
22
-
23
-
24
-
25
-
26
-
27
-
28
-
29
-
30
-
31
-
32
-
33
-
34
-
35
-
36
-
37
-
38
-
39
-
40
-
41
-
42
-
43
-
44
-
45
-
46
-
47
-
48
-
49
-
50
-
51
-
52
-
53
-
54
-
55
-
56
-
57
-
58
-
59
-
60
-
61
-
62
-
63
-
64
-
65
-
66
-
67
-
 68
68 -
 69
69 -
 70
70 -
 71
71 -
 72
72 -
 73
73 -
 74
74 -
 75
75 -
 76
76 -
 77
77 -
 78
78 -
 79
79 -
 80
80 -
 81
81 -
 82
82 -
 83
83 -
 84
84 -
 85
85 -
 86
86 -
 87
87 -
 88
88 -
89
-
90
-
91
-
92
-
93
-
94
-
95
-
96
-
97
-
98
-
99
-
100
-
101
-
102
-
103
-
104
-
105
-
106
-
107
-
108
-
109
-
110
-
111
-
112
-
113
-
114
-
115
-
116
-
117
-
118
-
119
-
120
-
121
-
122
-
123
-
124
-
125
-
126
-
127
-
128
-
129
-
130
-
131
-
132
-
133
-
134
-
135
-
136
-
137
-
138
-
139
-
140
-
141
-
142
-
143
-
144
-
145
-
146
-
147
-
148
-
149
-
150
-
151
-
152
 |
 |

2009/10 Annual Report Lenovo Group Limited
76
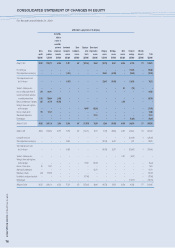
CONSOLIDATED STATEMENT OF CHANGES IN EQUITY
For the year ended March 31, 2010
Attributable to equity holders of the Company
Convertible
rights in
respect of
convertible
preferred Investment Share Employee Share-based
Share Share shares and revaluation redemption share compensation Hedging Exchange Other Retained Minority
capital premium warrants reserve reserve trusts reserve reserve reserve reserve earnings interests Total
US$’000 US$’000 US$’000 US$’000 US$’000 US$’000 US$’000 US$’000 US$’000 US$’000 US$’000 US$’000 US$’000
At April 1, 2009 29,530 1,106,379 42,159 75,501 497 (157,461) 92,684 (16,576) 25,691 30,738 81,596 177 1,310,915
Profit for the year – – – – – – – – – – 129,368 – 129,368
Other comprehensive income/(loss) – – – (3,135) – – – 22,645 (61,660) – (10,840) – (52,990)
Total comprehensive income/
(loss) for the year – – – (3,135) – – – 22,645 (61,660) – 118,528 – 76,378
Transfer to statutory reserve – – – – – – – – – 122 (122) – –
Issue of ordinary shares (Note 37) 359 63,141 – – – – – – – – – – 63,500
Conversion of Series A cumulative
convertible preferred shares 1,190 126,484 (3,970) – – – – – – – – – 123,704
Exercise and repurchase of warrants 205 31,578 (35,353) – – – – – – 3,570 – – –
Vesting of shares under long-term
incentive program – – – – – 46,407 (68,043) – – – – – (21,636)
Exercise of share options 104 13,536 – – – – – – – – – – 13,640
Share-based compensation – – – – – – 51,413 – – – – – 51,413
Dividends paid – – – – – – – – – – (11,896) – (11,896)
At March 31, 2010 31,388 1,341,118 2,836 72,366 497 (111,054) 76,054 6,069 (35,969) 34,430 188,106 177 1,606,018
At April 1, 2008 29,699 1,150,684 42,159 41,136 497 (172,235) 78,737 (1,788) (66,660) 24,537 486,323 174 1,613,263
(Loss)/profit for the year – – – – – – – – – – (226,392) 3 (226,389)
Other comprehensive income/(loss) – – – 34,365 – – – (14,788) 92,351 – 7,025 – 118,953
Total comprehensive income/
(loss) for the year – – – 34,365 – – – (14,788) 92,351 – (219,367) 3 (107,436)
Transfer to statutory reserve – – – – – – – – – 6,201 (6,201) – –
Vesting of shares under long-term
incentive program – – – – – 31,943 (40,167) – – – – – (8,224)
Exercise of share options 80 9,353 – – – – – – – – – – 9,433
Share-based compensation – – – – – – 54,114 – – – – – 54,114
Repurchase of shares (249) (53,658) – – – – – – – – – – (53,907)
Contribution to employee share trusts – – – – – (17,169) – – – – – – (17,169)
Dividends paid – – – – – – – – – – (179,159) – (179,159)
At March 31, 2009 29,530 1,106,379 42,159 75,501 497 (157,461) 92,684 (16,576) 25,691 30,738 81,596 177 1,310,915