Lenovo 2010 Annual Report Download - page 72
Download and view the complete annual report
Please find page 72 of the 2010 Lenovo annual report below. You can navigate through the pages in the report by either clicking on the pages listed below, or by using the keyword search tool below to find specific information within the annual report.-
 1
1 -
2
-
3
-
4
-
5
-
6
-
7
-
8
-
9
-
10
-
11
-
12
-
13
-
14
-
15
-
16
-
17
-
18
-
19
-
20
-
21
-
22
-
23
-
24
-
25
-
26
-
27
-
28
-
29
-
30
-
31
-
32
-
33
-
34
-
35
-
36
-
37
-
38
-
39
-
40
-
41
-
42
-
43
-
44
-
45
-
46
-
47
-
48
-
49
-
50
-
51
-
52
-
53
-
54
-
55
-
56
-
57
-
58
-
59
-
60
-
61
-
 62
62 -
 63
63 -
 64
64 -
 65
65 -
 66
66 -
 67
67 -
 68
68 -
 69
69 -
 70
70 -
 71
71 -
 72
72 -
 73
73 -
 74
74 -
 75
75 -
 76
76 -
 77
77 -
 78
78 -
 79
79 -
 80
80 -
 81
81 -
 82
82 -
83
-
84
-
85
-
86
-
87
-
88
-
89
-
90
-
91
-
92
-
93
-
94
-
95
-
96
-
97
-
98
-
99
-
100
-
101
-
102
-
103
-
104
-
105
-
106
-
107
-
108
-
109
-
110
-
111
-
112
-
113
-
114
-
115
-
116
-
117
-
118
-
119
-
120
-
121
-
122
-
123
-
124
-
125
-
126
-
127
-
128
-
129
-
130
-
131
-
132
-
133
-
134
-
135
-
136
-
137
-
138
-
139
-
140
-
141
-
142
-
143
-
144
-
145
-
146
-
147
-
148
-
149
-
150
-
151
-
152
 |
 |

2009/10 Annual Report Lenovo Group Limited
70
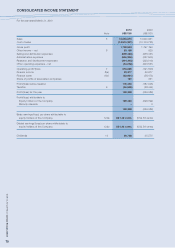
CONSOLIDATED INCOME STATEMENT
For the year ended March 31, 2010
2010 2009
Note US$’000 US$’000
Sales 5 16,604,815 14,900,931
Cost of sales (14,815,221) (13,103,735)
Gross profit 1,789,594 1,797,196
Other income – net 6 83,126 929
Selling and distribution expenses (839,388) (938,451)
Administrative expenses (566,245) (627,903)
Research and development expenses (214,343) (220,010)
Other operating expenses – net (34,058) (203,561)
Operating profit/(loss) 7 218,686 (191,800)
Finance income 8(a) 20,377 59,977
Finance costs 8(b) (62,881) (56,473)
Share of profits of associated companies 121 351
Profit/(loss) before taxation 176,303 (187,945)
Taxation 9 (46,935) (38,444)
Profit/(loss) for the year 129,368 (226,389)
Profit/(loss) attributable to
Equity holders of the Company 129,368 (226,392)
Minority interests – 3
129,368 (226,389)
Basic earnings/(loss) per share attributable to
equity holders of the Company 12(a) US1.42 cents (US2.56 cents)
Diluted earnings/(loss) per share attributable to
equity holders of the Company 12(b) US1.33 cents (US2.56 cents)
Dividends 13 68,728 35,575