Lenovo 2010 Annual Report Download - page 131
Download and view the complete annual report
Please find page 131 of the 2010 Lenovo annual report below. You can navigate through the pages in the report by either clicking on the pages listed below, or by using the keyword search tool below to find specific information within the annual report.-
 1
1 -
2
-
3
-
4
-
5
-
6
-
7
-
8
-
9
-
10
-
11
-
12
-
13
-
14
-
15
-
16
-
17
-
18
-
19
-
20
-
21
-
22
-
23
-
24
-
25
-
26
-
27
-
28
-
29
-
30
-
31
-
32
-
33
-
34
-
35
-
36
-
37
-
38
-
39
-
40
-
41
-
42
-
43
-
44
-
45
-
46
-
47
-
48
-
49
-
50
-
51
-
52
-
53
-
54
-
55
-
56
-
57
-
58
-
59
-
60
-
61
-
62
-
63
-
64
-
65
-
66
-
67
-
68
-
69
-
70
-
71
-
72
-
73
-
74
-
75
-
76
-
77
-
78
-
79
-
80
-
81
-
82
-
83
-
84
-
85
-
86
-
87
-
88
-
89
-
90
-
91
-
92
-
93
-
94
-
95
-
96
-
97
-
98
-
99
-
100
-
101
-
102
-
103
-
104
-
105
-
106
-
107
-
108
-
109
-
110
-
111
-
112
-
113
-
114
-
115
-
116
-
117
-
118
-
119
-
120
-
 121
121 -
 122
122 -
 123
123 -
 124
124 -
 125
125 -
 126
126 -
 127
127 -
 128
128 -
 129
129 -
 130
130 -
 131
131 -
 132
132 -
 133
133 -
 134
134 -
 135
135 -
 136
136 -
 137
137 -
 138
138 -
 139
139 -
 140
140 -
 141
141 -
142
-
143
-
144
-
145
-
146
-
147
-
148
-
149
-
150
-
151
-
152
 |
 |

2009/10 Annual Report Lenovo Group Limited
129129
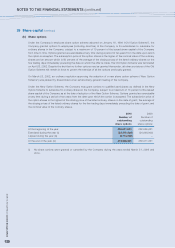
29 Share capital (continued)
(a) Long-term incentive program (continued)
Movements in the number of units of awards granted during the year and their related average fair values are as
follows:
Number of units
SARs RSUs PSUs
Outstanding at April 1, 2008 299,817,833 194,257,292 10,982,918
Granted during the year 290,145,645 231,923,705 –
Vested during the year (125,173,097) (82,027,769) (10,887,843)
Lapsed/cancelled during the year (51,354,953) (61,471,698) (95,075)
Outstanding at March 31, 2009 413,435,428 282,681,530 –
Outstanding at April 1, 2009 413,435,428 282,681,530 –
Granted during the year 96,610,284 61,351,183 –
Vested during the year (140,174,073) (93,518,476) –
Lapsed/cancelled during the year (32,018,260) (25,804,809) –
Outstanding at March 31, 2010 337,853,379 224,709,428 –
Average fair value per unit (HK$)
– At March 31, 2009 0.97 2.80 –
– At March 31, 2010 2.15 4.33 –
The fair values of the SARs awarded under the long-term incentive program for the years ended March 31, 2009 and
2010 was calculated by applying a Black-Scholes pricing model. The model inputs were the fair value (i.e. market
value) of the Company’s shares at the grant date, taking into account the expected volatility of 69.45 percent (2009:
59.43 percent), expected dividends during the vesting periods of 1.77 percent (2009: 1.90 percent), contractual life
of 4.75 years (2009: 4.75 years), and a risk-free interest rate of 1.37 percent (2009: 1.54 percent).
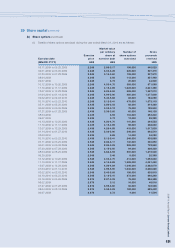
The remaining vesting periods of the awards under the long-term incentive program as at March 31, 2010 ranged
from 0.08 to 3.92 years (2009: 0.08 to 3.92 years).