Lenovo 2010 Annual Report Download - page 118
Download and view the complete annual report
Please find page 118 of the 2010 Lenovo annual report below. You can navigate through the pages in the report by either clicking on the pages listed below, or by using the keyword search tool below to find specific information within the annual report.-
 1
1 -
2
-
3
-
4
-
5
-
6
-
7
-
8
-
9
-
10
-
11
-
12
-
13
-
14
-
15
-
16
-
17
-
18
-
19
-
20
-
21
-
22
-
23
-
24
-
25
-
26
-
27
-
28
-
29
-
30
-
31
-
32
-
33
-
34
-
35
-
36
-
37
-
38
-
39
-
40
-
41
-
42
-
43
-
44
-
45
-
46
-
47
-
48
-
49
-
50
-
51
-
52
-
53
-
54
-
55
-
56
-
57
-
58
-
59
-
60
-
61
-
62
-
63
-
64
-
65
-
66
-
67
-
68
-
69
-
70
-
71
-
72
-
73
-
74
-
75
-
76
-
77
-
78
-
79
-
80
-
81
-
82
-
83
-
84
-
85
-
86
-
87
-
88
-
89
-
90
-
91
-
92
-
93
-
94
-
95
-
96
-
97
-
98
-
99
-
100
-
101
-
102
-
103
-
104
-
105
-
106
-
107
-
 108
108 -
 109
109 -
 110
110 -
 111
111 -
 112
112 -
 113
113 -
 114
114 -
 115
115 -
 116
116 -
 117
117 -
 118
118 -
 119
119 -
 120
120 -
 121
121 -
 122
122 -
 123
123 -
 124
124 -
 125
125 -
 126
126 -
 127
127 -
 128
128 -
129
-
130
-
131
-
132
-
133
-
134
-
135
-
136
-
137
-
138
-
139
-
140
-
141
-
142
-
143
-
144
-
145
-
146
-
147
-
148
-
149
-
150
-
151
-
152
 |
 |

2009/10 Annual Report Lenovo Group Limited
116
NOTES TO THE FINANCIAL STATEMENTS (continued)
116
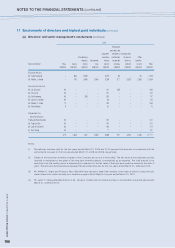
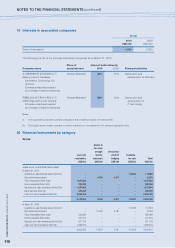
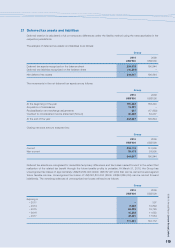
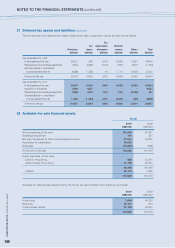
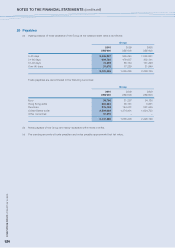
19 Interests in associated companies
Group
2010 2009
US$’000 US$’000
Share of net assets 1,061 2,635
The following is a list of the principal associated companies as at March 31, 2010:
Place of Interest held indirectly
Company name establishment 2010 2009 Principal activities
北京聯想傳奇信息技術有限公司 Chinese Mainland 45% 45% Distribution and
(Beijing Lenovo Parasaga development of software
Information Technology Co.
Limited)
(Chinese enterprise invested
by a foreign-invested enterprise)
閃聯信息技術工程中心有限公司 Chinese Mainland 23% 23% Distribution and
(IGRS Engineering Lab Limited) development of
(Chinese enterprise invested IT technology
by a foreign-invested enterprise)
Notes:
(i) The associated companies operate principally in their respective places of establishment.
(ii) The English name of each company is a direct translation or transliteration of its Chinese registered name.
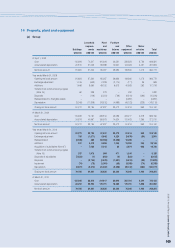
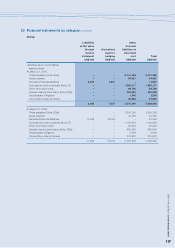
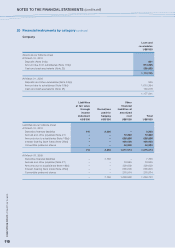
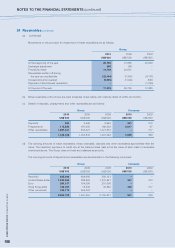
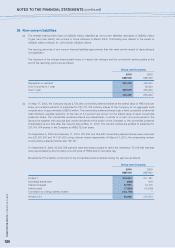
20 Financial instruments by category
Group
Assets at
fair value
through Derivatives
Loan and income used for Available-
receivables statement hedging for-sale Total
US$’000 US$’000 US$’000 US$’000 US$’000
Assets as per consolidated balance sheet
At March 31, 2010
Available-for-sale financial assets (Note 22) – – – 112,520 112,520
Derivative financial assets – 6,766 6,517 – 13,283
Trade receivables (Note 24(a)) 1,021,062 – – – 1,021,062
Notes receivable (Note 24(b)) 386,746 – – – 386,746
Deposits and other receivables (Note 24(c)) 1,287,894 – – – 1,287,894
Bank deposits (Note 25) 200,456 – – – 200,456
Cash and cash equivalents (Note 25) 2,238,195 – – – 2,238,195
5,134,353 6,766 6,517 112,520 5,260,156
At March 31, 2009
Available-for-sale financial assets (Note 22) – – – 101,916 101,916
Derivative financial assets – 10,676 2,487 – 13,163
Trade receivables (Note 24(a)) 482,086 – – – 482,086
Notes receivable (Note 24(b)) 221,575 – – – 221,575
Deposits and other receivables (Note 24(c)) 837,793 – – – 837,793
Cash and cash equivalents (Note 25) 1,863,379 – – – 1,863,379
3,404,833 10,676 2,487 101,916 3,519,912