Lenovo 2010 Annual Report Download - page 121
Download and view the complete annual report
Please find page 121 of the 2010 Lenovo annual report below. You can navigate through the pages in the report by either clicking on the pages listed below, or by using the keyword search tool below to find specific information within the annual report.-
 1
1 -
2
-
3
-
4
-
5
-
6
-
7
-
8
-
9
-
10
-
11
-
12
-
13
-
14
-
15
-
16
-
17
-
18
-
19
-
20
-
21
-
22
-
23
-
24
-
25
-
26
-
27
-
28
-
29
-
30
-
31
-
32
-
33
-
34
-
35
-
36
-
37
-
38
-
39
-
40
-
41
-
42
-
43
-
44
-
45
-
46
-
47
-
48
-
49
-
50
-
51
-
52
-
53
-
54
-
55
-
56
-
57
-
58
-
59
-
60
-
61
-
62
-
63
-
64
-
65
-
66
-
67
-
68
-
69
-
70
-
71
-
72
-
73
-
74
-
75
-
76
-
77
-
78
-
79
-
80
-
81
-
82
-
83
-
84
-
85
-
86
-
87
-
88
-
89
-
90
-
91
-
92
-
93
-
94
-
95
-
96
-
97
-
98
-
99
-
100
-
101
-
102
-
103
-
104
-
105
-
106
-
107
-
108
-
109
-
110
-
 111
111 -
 112
112 -
 113
113 -
 114
114 -
 115
115 -
 116
116 -
 117
117 -
 118
118 -
 119
119 -
 120
120 -
 121
121 -
 122
122 -
 123
123 -
 124
124 -
 125
125 -
 126
126 -
 127
127 -
 128
128 -
 129
129 -
 130
130 -
 131
131 -
132
-
133
-
134
-
135
-
136
-
137
-
138
-
139
-
140
-
141
-
142
-
143
-
144
-
145
-
146
-
147
-
148
-
149
-
150
-
151
-
152
 |
 |

2009/10 Annual Report Lenovo Group Limited
119119
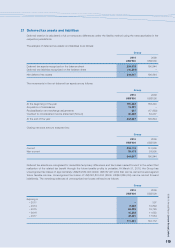
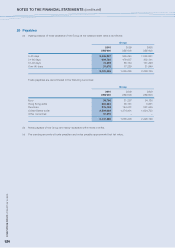
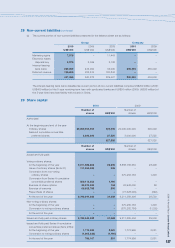
21 Deferred tax assets and liabilities
Deferred taxation is calculated in full on temporary differences under the liability method using the rates applicable in the
respective jurisdictions.
The analysis of deferred tax assets and liabilities is as follows:
Group
2010 2009
US$’000 US$’000
Deferred tax assets recognized on the balance sheet 254,978 190,844
Deferred tax liabilities recognized on the balance sheet (10,331) –
Net deferred tax assets 244,647 190,844
The movements in the net deferred tax assets are as follows:
Group
2010 2009
US$’000 US$’000
At the beginning of the year 190,844 156,440
Acquisition of subsidiaries 12,327 –
Reclassification and exchange adjustments 637 (17,833)
Credited to consolidated income statement (Note 9) 40,839 52,237
At the end of the year 244,647 190,844
Closing net book amount analyzed into:
Group
2010 2009
US$’000 US$’000
Current 205,174 151,939
Non-current 39,473 38,905
244,647 190,844
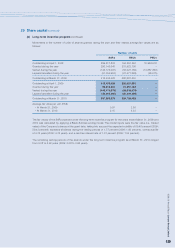
Deferred tax assets are recognized for deductible temporary differences and tax losses carried forward to the extent that
realization of the related tax benefit through the future taxable profits is probable. At March 31, 2010, the Group has
unrecognized tax losses of approximately US$234,632,000 (2009: US$187,001,000) that can be carried forward against
future taxable income. Unrecognized tax losses of US$122,801,000 (2009: US$64,889,000) can be carried forward
indefinitely. The remaining balances of unrecognized tax losses will expire as follows:
Group
2010 2009
US$’000 US$’000
Expiring in
– 2011 – 307
– 2014 6,556 72,849
– 2015 52,582 19,720
– 2016 10,392 11,652
– 2017 42,301 17,584
111,831 122,112