IBM 2007 Annual Report Download - page 9
Download and view the complete annual report
Please find page 9 of the 2007 IBM annual report below. You can navigate through the pages in the report by either clicking on the pages listed below, or by using the keyword search tool below to find specific information within the annual report.-
 1
1 -
 2
2 -
 3
3 -
 4
4 -
 5
5 -
 6
6 -
 7
7 -
 8
8 -
 9
9 -
 10
10 -
 11
11 -
 12
12 -
 13
13 -
 14
14 -
 15
15 -
 16
16 -
 17
17 -
 18
18 -
 19
19 -
 20
20 -
21
-
22
-
23
-
24
-
25
-
26
-
27
-
28
-
29
-
30
-
31
-
32
-
33
-
34
-
35
-
36
-
37
-
38
-
39
-
40
-
41
-
42
-
43
-
44
-
45
-
46
-
47
-
48
-
49
-
50
-
51
-
52
-
53
-
54
-
55
-
56
-
57
-
58
-
59
-
60
-
61
-
62
-
63
-
64
-
65
-
66
-
67
-
68
-
69
-
70
-
71
-
72
-
73
-
74
-
75
-
76
-
77
-
78
-
79
-
80
-
81
-
82
-
83
-
84
-
85
-
86
-
87
-
88
-
89
-
90
-
91
-
92
-
93
-
94
-
95
-
96
-
97
-
98
-
99
-
100
-
101
-
102
-
103
-
104
-
105
-
106
-
107
-
108
-
109
-
110
-
111
-
112
-
113
-
114
-
115
-
116
-
117
-
118
-
119
-
120
-
121
-
122
-
123
-
124
-
125
-
126
-
127
-
128
 |
 |

Ì
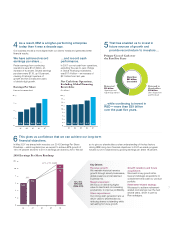
Key Drivers
Revenue growth:
We maintain historical revenue
growth through annuity businesses,
global presence and a balanced
business mix.
Margin expansion:
We focus on delivering higher
value to clients and on increasing
productivity, to improve profitability.
Share repurchases:
Our strong cash generation lets us
return value to shareholders by
reducing shares outstanding while
reinvesting for future growth.
Growth initiatives and future
acquisitions:
We invest in key growth initia-
tives and strategic acquisitions to
complement and scale our product
portfolio.
Retirement-related savings:
We expect to achieve retirement-
related cost savings over the next
several years, driven in part by
Plan redesigns.
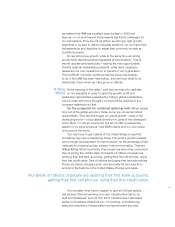
14%-16%
EPS CGR
(2006-2010)
0
2
4
6
$8
6.06
06
4.91
05
4.39
04
3.76
03 07
7.18
0
6
4
2
8
10
$12
06
6.06
07
7.18
08 09 10
10
11
12% - 15% CGR
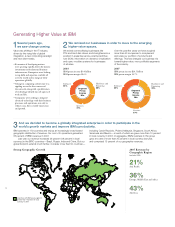
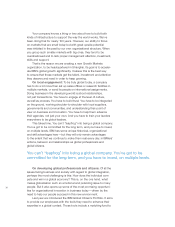
18%
Reinvested
$30 billion
Acquisitions and
Capital Expenditures
Returned to
Shareholders
$53 billion
Share Repurchases
and Dividends
More than
$83 billion
since 2003
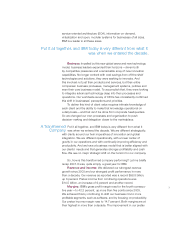
As a result, IBM is a higher-performing enterprise
today than it was a decade ago.
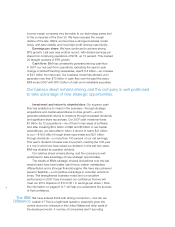
Our business model is more aligned with our clients’ needs and generates better
financial results.
4
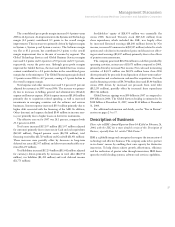
In May 2007 we shared with investors our 2010 Earnings Per Share
Roadmap — which explains how we expect to achieve EPS growth of
14 to 16 percent and $10 to $11 in earnings per share by 2010. We did
so to give our shareholders a clear understanding of the key factors
driving IBM’s long-term financial objectives. In 2007 we made progress
toward our 2010 objectives by growing earnings per share 18 percent.
This gives us confidence that we can achieve our long-term
financial objectives.
6
That has enabled us to invest in
future sources of growth and
provide record return to investors …
Primary Uses of Cash over
the Past Five Years
5
… while continuing to invest in
R&D — more than $29 billion
over the past five years.
2010 Earnings Per Share Roadmap
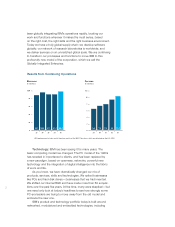
We have achieved record
earnings per share …
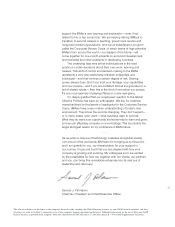
Pretax earnings from continuing
operations were $14.5 billion, an
increase of 9 percent. Diluted earnings
per share were $7.18, up 18 percent,
marking 20 straight quarters of
growth and five consecutive years
of double-digit growth.
Earnings Per Share
(from continuing operations)
… and record cash
performance.
In 2007 our net cash from operations,
excluding the year-to-year change
in Global Financing receivables,
was $17.4 billion — an increase of
$2.1 billion from last year.
Net Cash from Operations,
Excluding Global Financing
Receivables
($ in billions)
0
2
4
6
8
10
12
14
16
$18
03
12.6
04
12.9
05
13.1
06
15.3
07
17.4