IBM 2007 Annual Report Download - page 8
Download and view the complete annual report
Please find page 8 of the 2007 IBM annual report below. You can navigate through the pages in the report by either clicking on the pages listed below, or by using the keyword search tool below to find specific information within the annual report.-
 1
1 -
 2
2 -
 3
3 -
 4
4 -
 5
5 -
 6
6 -
 7
7 -
 8
8 -
 9
9 -
 10
10 -
 11
11 -
 12
12 -
 13
13 -
 14
14 -
 15
15 -
 16
16 -
 17
17 -
 18
18 -
 19
19 -
20
-
21
-
22
-
23
-
24
-
25
-
26
-
27
-
28
-
29
-
30
-
31
-
32
-
33
-
34
-
35
-
36
-
37
-
38
-
39
-
40
-
41
-
42
-
43
-
44
-
45
-
46
-
47
-
48
-
49
-
50
-
51
-
52
-
53
-
54
-
55
-
56
-
57
-
58
-
59
-
60
-
61
-
62
-
63
-
64
-
65
-
66
-
67
-
68
-
69
-
70
-
71
-
72
-
73
-
74
-
75
-
76
-
77
-
78
-
79
-
80
-
81
-
82
-
83
-
84
-
85
-
86
-
87
-
88
-
89
-
90
-
91
-
92
-
93
-
94
-
95
-
96
-
97
-
98
-
99
-
100
-
101
-
102
-
103
-
104
-
105
-
106
-
107
-
108
-
109
-
110
-
111
-
112
-
113
-
114
-
115
-
116
-
117
-
118
-
119
-
120
-
121
-
122
-
123
-
124
-
125
-
126
-
127
-
128
 |
 |
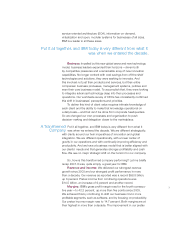
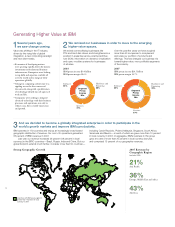
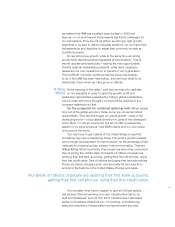
21%
36%
43%
Asia Pacific
Europe, Middle East and Africa
Americas
Generating Higher Value at IBM
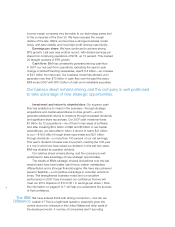
Several years ago,
we saw change coming.
Value was shifting in the IT industry,
driven by the rising tide of global
integration, a new computing paradigm
and new client needs.
UÑÑViÈÑwÑ`iäi°Ñ>ÓÈÑ
åiÅiÑÅåÑÅ>°`ç]Ñ`ÅäiÑLçÑÈÓÅVÑ
äiÈÓiÓÈÑÑwÞ`>iÓ>ÑLÞÈiÈÈÑ
wÅ>ÈÓÅÞVÓÞÅiµÑÓiÅ°ÅÈiÈÑåiÅiÑÑ
ÓÑÓ>°ÑÈÈÑ>`Ñiæ°iÅÓÈiÑ>ä>>LiÑ>Ñ
äiÅÑÓiÑåÅ`Ñ>`ÑÓÑÓiÅ>ÓiÑÓiÅÑ
°iÅ>ÓÈÑL>çµ
UÑÑ>iÑÑV°ÞÓÑ>ÅVÓiVÓÞÅiÑå>ÈÑ
Å°°Ñ>VÅÈÈÑÓiÑ`>Ó>ÑViÓiÅÑ>`Ñ
ÓiÑiÓåÅ]Ñ>ÑåÓÑ>Ñ°ÅwiÅ>ÓÑ
wÑÓiVçÑwÞÈi`ÑÓÑ>Ñ>È°iVÓÈÑwÑ
work and life.
UÑÑ°>iÈÑåiÅiÑÈiiÑÓÑÓiÅ>ÓiÑ
>`ä>Vi`ÑÓiVçÑåÓÑÓiÅÑLÞÈiÈÈÑ
°ÅViÈÈiÈÑ>`Ñ°iÅ>ÓÈ]ÑÓÑçÑÓÑ
Åi`ÞViÑVÈÓÈ]ÑLÞÓÑÓÑi>LiÑä>ÓÑ
>`ÑÅåÓµ
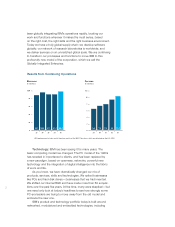
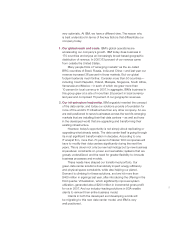
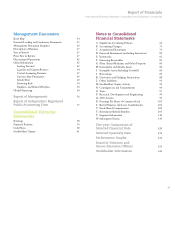
1We remixed our businesses in order to move to the emerging
higher-value spaces.
We exited commoditizing businesses like
PCs and hard disk drives, and strengthened our
position in areas like service-oriented architec-
ture (SOA), information on demand, virtualization
and open, modular systems for businesses
of all sizes.
Over the past five years we have acquired
more than 60 companies to complement
and scale our portfolio of products and
offerings. This has changed our business mix
toward higher-value, more profitable segments
of the industry.
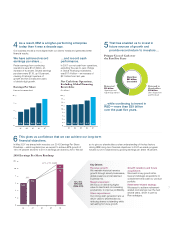
Software
40%
Services
37%
Hardware and
Financing
23%
Software
34%
Services
41%
Hardware and
Financing
25%
2003 2007
Ñ°ÅiÓ>æÑViÑfµ}ÑLÑ Ñ°ÅiÓ>æÑViÑf§}µyÑL
Ñ°ÅiÓ>æÑ>ÅѧíµÎ´Ñ Ñ°ÅiÓ>æÑ>Åѧ}µÌ´
Segment
Pretax
Income
Mix
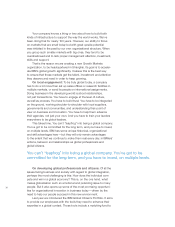
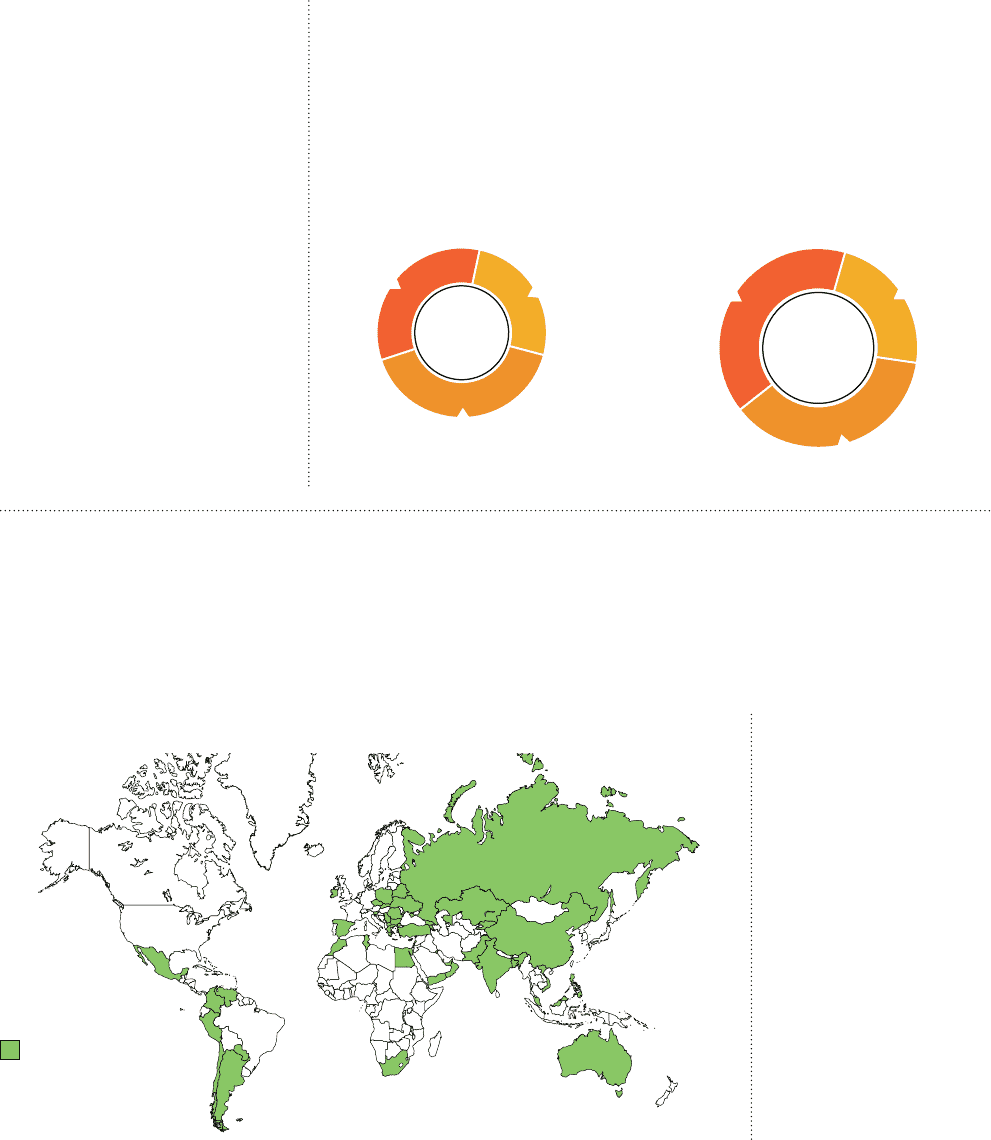
And we decided to become a globally integrated enterprise in order to participate in the
world’s growth markets and improve IBM’s productivity.
IBM operates in 170 countries and enjoys an increasingly broad-based
geographic distribution of revenue. Our non-U.S. operations generated
63 percent of IBM’s revenue in 2007.
Last year our revenue increased 26 percent (18 percent in local
currency) in the BRIC countries — Brazil, Russia, India and China. But our
global footprint extends much farther. Consider more than 50 countries —
including Czech Republic, Poland, Malaysia, Singapore, South Africa,
Venezuela and Mexico — in each of which we grew more than 10 percent
in local currency in 2007. In aggregate, IBM’s business in this group
grew at a rate of more than 20 percent in local currency last year,
and comprised 15 percent of our geographic revenues.
3
Segment
Pretax
Income
Mix
Countries with IBM revenue growth
greater than 10 percent in local
currency in 2007
2
Strong Geographic Growth 2007 Revenue by
Geographic Region
(excludes OEM)
Î