IBM 2007 Annual Report Download - page 25
Download and view the complete annual report
Please find page 25 of the 2007 IBM annual report below. You can navigate through the pages in the report by either clicking on the pages listed below, or by using the keyword search tool below to find specific information within the annual report.-
 1
1 -
2
-
3
-
4
-
5
-
6
-
7
-
8
-
9
-
10
-
11
-
12
-
13
-
14
-
 15
15 -
 16
16 -
 17
17 -
 18
18 -
 19
19 -
 20
20 -
 21
21 -
 22
22 -
 23
23 -
 24
24 -
 25
25 -
 26
26 -
 27
27 -
 28
28 -
 29
29 -
 30
30 -
 31
31 -
 32
32 -
 33
33 -
 34
34 -
 35
35 -
36
-
37
-
38
-
39
-
40
-
41
-
42
-
43
-
44
-
45
-
46
-
47
-
48
-
49
-
50
-
51
-
52
-
53
-
54
-
55
-
56
-
57
-
58
-
59
-
60
-
61
-
62
-
63
-
64
-
65
-
66
-
67
-
68
-
69
-
70
-
71
-
72
-
73
-
74
-
75
-
76
-
77
-
78
-
79
-
80
-
81
-
82
-
83
-
84
-
85
-
86
-
87
-
88
-
89
-
90
-
91
-
92
-
93
-
94
-
95
-
96
-
97
-
98
-
99
-
100
-
101
-
102
-
103
-
104
-
105
-
106
-
107
-
108
-
109
-
110
-
111
-
112
-
113
-
114
-
115
-
116
-
117
-
118
-
119
-
120
-
121
-
122
-
123
-
124
-
125
-
126
-
127
-
128
 |
 |

Management Discussion
International Business Machines Corporation and Subsidiary Companies
23
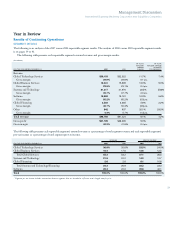
Year in Review
Results of Continuing Operations
SEGMENT DETAILS
The following is an analysis of the 2007 versus 2006 reportable segment results. The analysis of 2006 versus 2005 reportable segment results
is on pages 39 to 41.
The following table presents each reportable segment’s external revenue and gross margin results.
($ in millions)
YR .-TO-YR. YR .-TO-YR.
PERCENT/ PERCENT CHANGE
MARGIN ADJUSTED
FOR THE YEAR ENDED DECEMBER 31: 2007 2006 CHANGE FOR CURRENCY
Revenue:
Global Technology Services $36,103 $32,322 11.7% 7.4%
Gross margin 29.9% 29.8% 0.1 pts.
Global Business Services 18,041 15,969 13.0% 9.0%
Gross margin 23.5% 23.1% 0.4 pts.
Systems and Technology 21,317 21,970 (3.0)% (5.8)%
Gross margin 39.7% 37.7% 2.0 pts.
Software 19,982 18,161 10.0% 5.6%
Gross margin 85.2% 85.2% (0.0) pts.
Global Financing 2,502 2,365 5.8% 2.2%
Gross margin 46.7% 50.3% (3.5) pts.
Other 842 637 32.1% 29.5%
Gross margin 4.4% 5.7% (1.4) pts.
Total revenue $98,786 $91,424 8.1% 4.2%
Gross profit $41,729 $38,295 9.0%
Gross margin 42.2% 41.9% 0.4 pts.
The following table presents each reportable segment’s external revenue as a percentage of total segment revenue and each reportable segment’s
pre-tax income as a percentage of total segment pre-tax income.
REVENUE PRE-TAX INCOME*
FOR THE YEAR ENDED DECEMBER 31: 2007 2006 2007 2006
Global Technology Services 36.9% 35.6% 23.5% 24.0%
Global Business Services 18.4 17.6 13.6 12.5
Total Global Services 55.3 53.2 37.1 36.5
Systems and Technology 21.8 24.2 14.2 12.7
Global Financing 2.6 2.6 9.1 10.6
Total Systems and Technology/Financing 24.3 26.8 23.3 23.3
Software 20.4 20.0 39.6 40.1
Total 100.0% 100.0% 100.0% 100.0%
* Segment pre-tax income includes transactions between segments that are intended to reflect an arm’s-length transfer price.