IBM 2007 Annual Report Download - page 38
Download and view the complete annual report
Please find page 38 of the 2007 IBM annual report below. You can navigate through the pages in the report by either clicking on the pages listed below, or by using the keyword search tool below to find specific information within the annual report.-
 1
1 -
2
-
3
-
4
-
5
-
6
-
7
-
8
-
9
-
10
-
11
-
12
-
13
-
14
-
15
-
16
-
17
-
18
-
19
-
20
-
21
-
22
-
23
-
24
-
25
-
26
-
27
-
 28
28 -
 29
29 -
 30
30 -
 31
31 -
 32
32 -
 33
33 -
 34
34 -
 35
35 -
 36
36 -
 37
37 -
 38
38 -
 39
39 -
 40
40 -
 41
41 -
 42
42 -
 43
43 -
 44
44 -
 45
45 -
 46
46 -
 47
47 -
 48
48 -
49
-
50
-
51
-
52
-
53
-
54
-
55
-
56
-
57
-
58
-
59
-
60
-
61
-
62
-
63
-
64
-
65
-
66
-
67
-
68
-
69
-
70
-
71
-
72
-
73
-
74
-
75
-
76
-
77
-
78
-
79
-
80
-
81
-
82
-
83
-
84
-
85
-
86
-
87
-
88
-
89
-
90
-
91
-
92
-
93
-
94
-
95
-
96
-
97
-
98
-
99
-
100
-
101
-
102
-
103
-
104
-
105
-
106
-
107
-
108
-
109
-
110
-
111
-
112
-
113
-
114
-
115
-
116
-
117
-
118
-
119
-
120
-
121
-
122
-
123
-
124
-
125
-
126
-
127
-
128
 |
 |

Management Discussion
International Business Machines Corporation and Subsidiary Companies
36
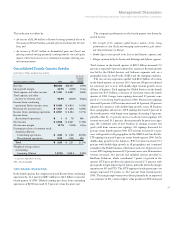
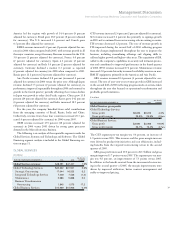
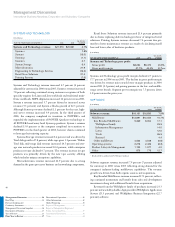
expense management. GBS revenue increased 16.8 percent (10 percent
adjusted for currency) with growth in all geographies and sectors.
Revenue performance was led by growth in AMS offerings and
double-digit growth across all consulting service lines. GBS signings
decreased 20 percent, driven by a 48-percent decline in longer term
signings when compared to a very strong fourth quarter of 2006.
Shorter term signings increased 9 percent to $3.9 billion for the
quarter, the highest level of shorter term signings achieved in any
quarter in this business. GBS gross profit increased 9.0 percent in the
quarter, with a gross margin decline of 1.7 points due to higher
employee bonus compensation costs. The GBS segment contributed
$0.6 billion of pre-tax profit in the quarter, an increase of 9.2 percent
versus the fourth quarter of 2006. Pre-tax profit margin declined 0.5
points to 11.3 percent driven primarily by the impact of higher
employee bonus compensation in the quarter, partially offset by
improved expense productivity.
Systems and Technology segment revenue was $6.8 billion, a
decrease of 3.9 percent as reported (8 percent adjusted for currency),
when compared to the fourth quarter of 2006; excluding the divested
printer business, revenue was essentially flat (decreased 4 percent
adjusted for currency). System z revenue decreased 15.1 percent,
with revenue declines in the U.S. and EMEA, partially offset by
double-digit revenue growth in Asia Pacific. This was the tenth quar-
ter of a long and successful technology cycle for System z; MIPS
shipments decreased 4 percent year to year. System i revenue
increased 2.0 percent driven primarily by growth in POWER6 servers.
System p revenue grew 9.5 percent, with growth in all geographies
led by double-digit growth in Asia Pacific. This was the sixth con-
secutive quarter of revenue growth for System p, driven primarily by
POWER6 servers. System x revenue increased 4.3 percent with
growth in server products (6 percent) and blades (31 percent).
Performance in the quarter reflected strong acceptance of the new
BladeCenter-S, which was introduced at the end of the quarter, and
strong demand for the new high-end Quad-Core processor servers.
Systems Storage revenue increased 10.8 percent, driven by growth in
tape products of 22 percent and external disk products of 7 percent.
Retail Store Solutions revenue increased 5.9 percent. Microelectronics
revenue declined 15.2 percent driven by a slowdown in demand for
game processors. Segment gross margin at 45.7 percent, improved
3.9 points versus the fourth quarter of 2006 with margin improve-
ment in every system brand, except System i. Systems and Technology
segment pre-tax profit increased 17.8 percent to $1.4 billion. Pre-tax
margin improved 3.8 points to 19.4 percent, driven primarily by
operational cost management, a mix to higher end models within the
brands and the value of the new POWER6 products in the market.
Software segment revenue of $6.3 billion, increased 11.6 percent
(6 percent adjusted for currency), reflecting strong execution in clos-
ing transactions in the quarter and continued strong demand for the
Key Branded Middleware products. Revenue growth this quarter was
primarily organic, as the company wrapped around prior year acqui-
sitions. Revenue from Key Branded Middleware increased 15.4 percent
(9 percent adjusted for currency) and represented 58 percent of total
software revenue. Revenue from the WebSphere Family of products
grew 22.8 percent in the quarter, with strong performance tied to the
industry’s adoption of services-oriented architecture. Information
Management revenue increased 11.4 percent. The FileNet acquisi-
tion, now in its second year, contributed to the revenue growth.
Lotus revenue increased 6.7 percent compared to a very strong
fourth quarter of 2006. This is the thirteenth consecutive quarter of
growth from Lotus software. Lotus Connections, which was released
in June 2007, has been rapidly adopted by customers. Tivoli software
revenue increased 19.0 percent with double-digit growth in Systems
Management, Security and Storage products. Rational revenue
increased 22.2 percent in the quarter, as the company’s largest cus-
tomers embraced this integrated product set. Software gross profit
increased 12.4 percent in the quarter, with margin improvement of
0.6 points. In addition to the strong revenue and gross profit perfor-
mance in the fourth quarter, the Software segment delivered pre-tax
profit of $2.4 billion, an increase of 20.8 percent. The pre-tax margin
of 34.9 percent increased 2.6 points, reflecting the strong revenue
growth with a relatively fixed cost base.
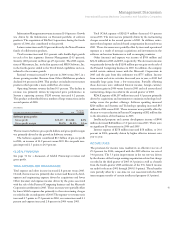
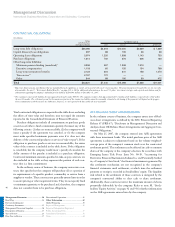
Global Financing revenue increased 7.7 percent (2 percent adjusted
for currency), driven primarily by increased sales of used equipment.
From a geographic perspective, revenue increased in all geogra-
phies, led by strong performance in Asia Pacific, EMEA and the
emerging countries. Americas’ revenue was $11.7 billion, an increase
of 4.8 percent as reported (2 percent adjusted for currency). EMEA
revenue increased 16.2 percent (6 percent adjusted for currency) to
$10.8 billion. Revenue increased in most of the major countries,
when adjusted for currency, led by Spain which was up 15 percent.
Asia Pacific revenue increased 14.7 percent (9 percent adjusted for
currency) to $5.5 billion, led by growth in the India, Greater China,
Australia/New Zealand, ASEAN and Korea regions. Collectively,
these regions increased 20.3 percent, adjusted for currency, versus
the fourth quarter of 2006. The emerging BRIC countries of Brazil,
Russia, India and China together grew 29.4 percent (18 percent
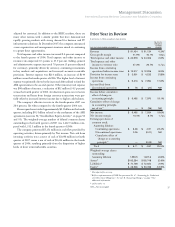
Management Discussion ............................ 14
Road Map .........................................................14
Forward-Looking and
Cautionary Statements .....................................15
Management Discussion Snapshot ..................16
Description of Business ....................................17
Year in Review ............................................ 23
Prior Year in Review .................................. 37
Discontinued Operations .................................42
Other Information ............................................42
Global Financing ..............................................50
Report of Management ....................................56
Report of Independent Registered
Public Accounting Firm ...................................57
Consolidated Statements ..................................58
Notes .................................................................64