IBM 2007 Annual Report Download - page 31
Download and view the complete annual report
Please find page 31 of the 2007 IBM annual report below. You can navigate through the pages in the report by either clicking on the pages listed below, or by using the keyword search tool below to find specific information within the annual report.-
 1
1 -
2
-
3
-
4
-
5
-
6
-
7
-
8
-
9
-
10
-
11
-
12
-
13
-
14
-
15
-
16
-
17
-
18
-
19
-
20
-
 21
21 -
 22
22 -
 23
23 -
 24
24 -
 25
25 -
 26
26 -
 27
27 -
 28
28 -
 29
29 -
 30
30 -
 31
31 -
 32
32 -
 33
33 -
 34
34 -
 35
35 -
 36
36 -
 37
37 -
 38
38 -
 39
39 -
 40
40 -
 41
41 -
42
-
43
-
44
-
45
-
46
-
47
-
48
-
49
-
50
-
51
-
52
-
53
-
54
-
55
-
56
-
57
-
58
-
59
-
60
-
61
-
62
-
63
-
64
-
65
-
66
-
67
-
68
-
69
-
70
-
71
-
72
-
73
-
74
-
75
-
76
-
77
-
78
-
79
-
80
-
81
-
82
-
83
-
84
-
85
-
86
-
87
-
88
-
89
-
90
-
91
-
92
-
93
-
94
-
95
-
96
-
97
-
98
-
99
-
100
-
101
-
102
-
103
-
104
-
105
-
106
-
107
-
108
-
109
-
110
-
111
-
112
-
113
-
114
-
115
-
116
-
117
-
118
-
119
-
120
-
121
-
122
-
123
-
124
-
125
-
126
-
127
-
128
 |
 |

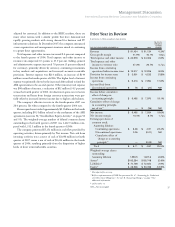
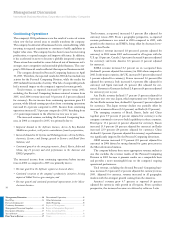
Management Discussion
International Business Machines Corporation and Subsidiary Companies
29
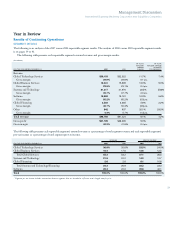
Global Services revenue. In addition, Bad debt expense increased
$113 million primarily due to an increase in the provision for doubt-
ful accounts. The reserve coverage for receivables at year end was
1.5 percent, essentially flat versus year-end 2006. Workforce reduc-
tions — ongoing increased as a result of actions taken to address cost
issues in GTS, primarily in SO, during the second quarter of 2007.
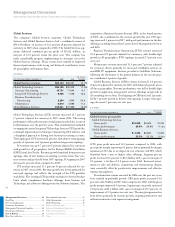
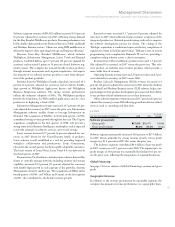
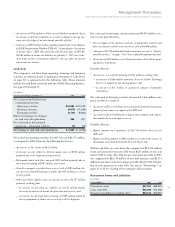
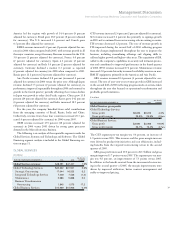
Other (Income) and Expense
($ in millions)
YR.-TO-YR.
FOR THE YEAR ENDED DECEMBER 31: 2007 2006* CHANGE
Foreign currency
transaction gains $(143) $(130) 10.1%
Losses on derivative instruments 382 135 183.5
Interest income (565) (536) 5.3
Net gains from securities
and investments assets (68) (40) 68.5
Net realized gains from
certain real estate activities (18) (41) (56.0)
Other (214) (154) 39.3
Total $(626) $(766) (18.3)%
* Reclassified to conform with 2007 presentation deleting 2006 categories for Restructuring
$(7) million and $(45) million for Lenovo/Microsoft gains and combining these items in
the Other category for both years.
Other (income) and expense was income of $626 million and $766
million in 2007 and 2006, respectively. The decrease in income was
primarily due to higher losses on derivative instruments. The com-
pany hedges its major cross-border cash flows to mitigate the effect
of currency volatility in the year-over-year results. The impact of
these hedging programs is primarily reflected in Other (income) and
expense, as well as cost of goods sold. This year, losses from deriva-
tives, as a result of currency movements, resulted in $247 million of
year-to-year impact to Other (income) and expense. This decrease in
income was partially offset by a gain from the divestiture of the printing
business in the second quarter and sales of Lenovo stock in the first
and second quarters of 2007 (see note C, “Acquisitions/Divestitures,”
on pages 80 and 81 for additional information).
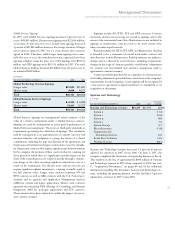
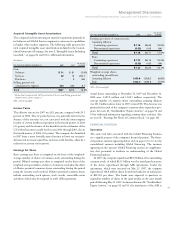
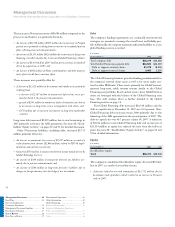
Research, Development and Engineering
($ in millions)
YR.-TO-YR.
FOR THE YEAR ENDED DECEMBER 31: 2007 2006 CHANGE
Research, development
and engineering:
Total $6,153 $6,107 0.8%
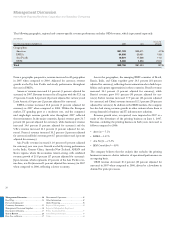
Total Expense and Other Income
($ in millions)
YR.-TO-YR.
FOR THE YEAR ENDED DECEMBER 31: 2007 2006 CHANGE
Total expense and other income $27,240 $24,978 9.1%
Expense to Revenue 27.6% 27.3% 0.3 pts.
Total expense and other income increased 9.1 percent (5 percent
adjusted for currency) in 2007 versus 2006. Overall, the increase was
primarily due to increased Selling, general and administrative
(SG&A) expense and Interest expense. SG&A expense increased
$1,801 million primarily due to acquisition related spending, as well
as increased investments in emerging countries and the software and
services businesses. Interest expense increased $333 million primarily
due to higher debt associated with the financing of the ASR agree-
ments. In addition, Other (income) and expense declined $140 million
in income primarily due to higher losses on derivative instruments.
The expense-to-revenue ratio increased 0.3 points to 27.6 percent in
2007, as revenue increased 8.1 percent and expense increased 9.1
percent in 2007 versus 2006. For additional information regarding
the increase in Total expense and other income, see the following
analyses by category:
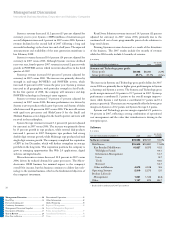
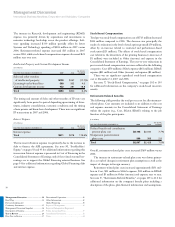
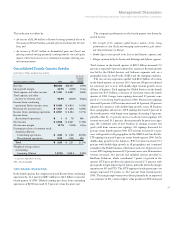
Selling, General and Administrative
($ in millions)
YR.-TO-YR.
FOR THE YEAR ENDED DECEMBER 31: 2007 2006* CHANGE
Selling, general and
administrative — base $19,078 $17,457 9.3%
Advertising and promotional expense 1,242 1,195 3.9
Workforce reductions — ongoing 318 272 16.6
Amortization expense —
acquired intangibles 234 220 6.7
Retirement-related expense 607 587 3.5
Stock-based compensation 480 541 (11.3)
Bad debt expense 100 (13) NM
Total $22,060 $20,259 8.9%
* Reclassified to conform with 2007 presentation as the Restructuring category ($33 million
in 2007 and $15 million in 2006) was combined into the SG&A — base category.
NM — Not meaningful
Total SG&A expense increased 8.9 percent (6 percent adjusted for
currency). The increase was primarily driven by acquisition-related
spending (3 points), the effects of currency (3 points) and investments
in the software and services businesses, as well as emerging markets.
These investments reflect the continuing business mix shift to higher
value offerings which require higher operating expenses. The returns
on these investments are reflected in the momentum in Key Branded
Middleware offerings, growth in emerging markets and improved