IBM 2007 Annual Report Download - page 85
Download and view the complete annual report
Please find page 85 of the 2007 IBM annual report below. You can navigate through the pages in the report by either clicking on the pages listed below, or by using the keyword search tool below to find specific information within the annual report.-
 1
1 -
2
-
3
-
4
-
5
-
6
-
7
-
8
-
9
-
10
-
11
-
12
-
13
-
14
-
15
-
16
-
17
-
18
-
19
-
20
-
21
-
22
-
23
-
24
-
25
-
26
-
27
-
28
-
29
-
30
-
31
-
32
-
33
-
34
-
35
-
36
-
37
-
38
-
39
-
40
-
41
-
42
-
43
-
44
-
45
-
46
-
47
-
48
-
49
-
50
-
51
-
52
-
53
-
54
-
55
-
56
-
57
-
58
-
59
-
60
-
61
-
62
-
63
-
64
-
65
-
66
-
67
-
68
-
69
-
70
-
71
-
72
-
73
-
74
-
 75
75 -
 76
76 -
 77
77 -
 78
78 -
 79
79 -
 80
80 -
 81
81 -
 82
82 -
 83
83 -
 84
84 -
 85
85 -
 86
86 -
 87
87 -
 88
88 -
 89
89 -
 90
90 -
 91
91 -
 92
92 -
 93
93 -
 94
94 -
 95
95 -
96
-
97
-
98
-
99
-
100
-
101
-
102
-
103
-
104
-
105
-
106
-
107
-
108
-
109
-
110
-
111
-
112
-
113
-
114
-
115
-
116
-
117
-
118
-
119
-
120
-
121
-
122
-
123
-
124
-
125
-
126
-
127
-
128
 |
 |

83
Notes to Consolidated Financial Statements
International Business Machines Corporation and Subsidiary Companies
LOANS AND FINANCING RECEIVABLES
Estimates of fair value are based on discounted future cash flows
using current interest rates offered for similar loans to clients with
similar credit ratings for the same remaining maturities.
RESTRICTED SECURITIES
The fair value of restricted securities was estimated based on a quoted
price for an identical unrestricted security, adjusted to reflect the
effect of the restriction.
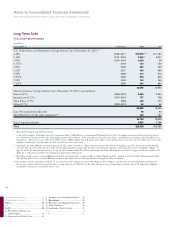
LONG-TERM DEBT
For publicly-traded debt, estimates of fair value are based on market
prices. For other debt, fair value is estimated based on rates cur-
rently available to the company for debt with similar terms and
remaining maturities.
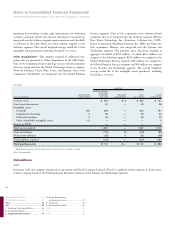
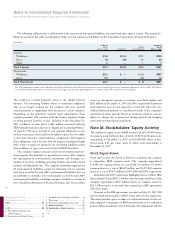
Marketable Securities*
The following table summarizes the company’s marketable securities,
all of which are considered available-for-sale, and alliance investments.
($ in millions)
FAIR VALUE
AT DECEMBER 31: 2007 2006
Marketable securities — current:
Time deposits and other obligations
$1,155 $2,634
Marketable securities — noncurrent:**
Time deposits and other obligations
$ 530 $ 359
Non-U.S. government securities and
other fixed-term obligations 1 2
Total $ 531 $ 361
Non-equity method alliance investments** $ 879 $ 628
* Gross unrealized gains (before taxes) on marketable securities were $7 million and $19
million at December 31, 2007 and 2006, respectively. Gross unrealized gains (before
taxes) on alliance investments were $545 million and $178 million at December 31, 2007
and 2006, respectively. Gross unrealized losses (before taxes) on marketable securities
were immaterial to the Consolidated Financial Statements at December 31, 2007 and
2006. Gross unrealized losses (before taxes) on alliance investments were $18 million
at December 31, 2007 and immaterial to the Consolidated Financial Statements at
December 31, 2006. See note M, “Stockholders’ Equity Activity,” on page 93 for net
change in unrealized gains and losses on marketable securities.
** Included within Investments and sundry assets in the Consolidated Statement of Financial
Position. See note H, “Investments and Sundry Assets,” on page 84.
Note E. Inventories
($ in millions)
AT DECEMBER 31: 2007 2006
Finished goods $ 668 $ 506
Work in process and raw materials 1,996 2,304
Total $2,664 $2,810
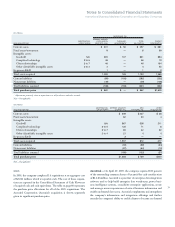
Note F. Financing Receivables
($ in millions)
AT DECEMBER 31: 2007 2006
Current:
Net investment in sales-type leases $ 4,746 $ 4,590
Commercial financing receivables 6,263 5,814
Client loan receivables 4,652 4,196
Installment payment receivables 629 496
Total $16,289 $15,095
Noncurrent:
Net investment in sales-type leases $ 6,085 $ 5,471
Commercial financing receivables 113 32
Client loan receivables 4,931 4,214
Installment payment receivables 474 351
Total $11,603 $10,068
Net investment in sales-type leases is for leases that relate principally
to the company’s equipment and are for terms ranging from two to
seven years. Net investment in sales-type leases includes unguaran-
teed residual values of $915 million and $854 million at December
31, 2007 and 2006, respectively, and is reflected net of unearned
income of $1,016 million and $1,005 million and of allowance for
uncollectible accounts of $127 million and $135 million at those
dates, respectively. Scheduled maturities of minimum lease payments
outstanding at December 31, 2007, expressed as a percentage of the
total, are approximately: 2008, 50 percent; 2009, 30 percent; 2010,
15 percent; 2011, 5 percent; and 2012 and beyond, 1 percent.
Commercial financing receivables relate primarily to inventory
and accounts receivable financing for dealers and remarketers of IBM
and non-IBM products. Payment terms for inventory and accounts
receivable financing generally range from 30 to 90 days.
Client loan receivables relate to loans that are provided by Global
Financing primarily to the company’s clients to finance the purchase
of the company’s software and services. Separate contractual relation-
ships on these financing arrangements are for terms ranging from
two to seven years. Each financing contract is priced independently
at competitive market rates. The company has a history of enforcing
the terms of these separate financing agreements.
The company utilizes certain of its financing receivables as col-
lateral for non-recourse borrowings. Financing receivables pledged
as collateral for borrowings were $258 million and $304 million at
December 31, 2007 and 2006, respectively. These borrowings are
included in note J, “Borrowings,” on pages 85 to 88.
The company did not have any financing receivables held for sale
as of December 31, 2007 and 2006.