IBM 2007 Annual Report Download - page 34
Download and view the complete annual report
Please find page 34 of the 2007 IBM annual report below. You can navigate through the pages in the report by either clicking on the pages listed below, or by using the keyword search tool below to find specific information within the annual report.-
 1
1 -
2
-
3
-
4
-
5
-
6
-
7
-
8
-
9
-
10
-
11
-
12
-
13
-
14
-
15
-
16
-
17
-
18
-
19
-
20
-
21
-
22
-
23
-
 24
24 -
 25
25 -
 26
26 -
 27
27 -
 28
28 -
 29
29 -
 30
30 -
 31
31 -
 32
32 -
 33
33 -
 34
34 -
 35
35 -
 36
36 -
 37
37 -
 38
38 -
 39
39 -
 40
40 -
 41
41 -
 42
42 -
 43
43 -
 44
44 -
45
-
46
-
47
-
48
-
49
-
50
-
51
-
52
-
53
-
54
-
55
-
56
-
57
-
58
-
59
-
60
-
61
-
62
-
63
-
64
-
65
-
66
-
67
-
68
-
69
-
70
-
71
-
72
-
73
-
74
-
75
-
76
-
77
-
78
-
79
-
80
-
81
-
82
-
83
-
84
-
85
-
86
-
87
-
88
-
89
-
90
-
91
-
92
-
93
-
94
-
95
-
96
-
97
-
98
-
99
-
100
-
101
-
102
-
103
-
104
-
105
-
106
-
107
-
108
-
109
-
110
-
111
-
112
-
113
-
114
-
115
-
116
-
117
-
118
-
119
-
120
-
121
-
122
-
123
-
124
-
125
-
126
-
127
-
128
 |
 |

Management Discussion
International Business Machines Corporation and Subsidiary Companies
32
In addition, Stockholders’ equity improved $4.7 billion as a result
of changes from pension remeasurements and current year activity
within Accumulated gains and (losses) not affecting retained earn-
ings. See note U, “Retirement-Related Benefits,” on pages 105 to
116 for additional information.
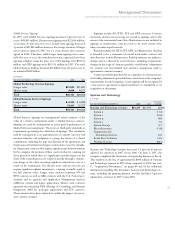
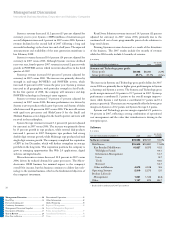
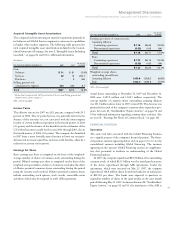
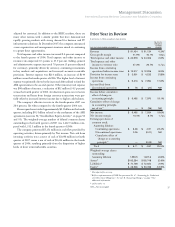
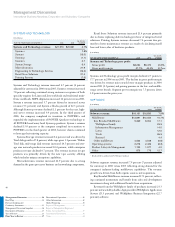
Working Capital
($ in millions)
AT DECEMBER 31: 2007 2006
Current assets $53,177 $44,660
Current liabilities 44,310 40,091
Working capital $ 8,867 $ 4,569
Current ratio 1.20 1.11
Working capital increased $4,298 million compared to the prior year
primarily as a result of a net increase in Current assets. The key driv-
ers are described below:
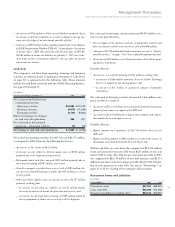
Current assets increased $8,517 million due to:
U An increase of $5,490 million in Cash and cash equivalents and Marketable
securities including a $299 million currency impact. See Cash Flow
analysis on page 33.
U An increase of $1,941 million in short-term receivables driven by:
— increase of $460 million in financing receivables due to asset growth
in commercial financing and client loans; and
— approximately $1,325 million currency impact.
U An increase of $1,351 million in Prepaid expenses and other current assets
primarily resulting from:
— an increase of $335 million in derivative assets primarily due to
changes in foreign currency rates for certain cash flow hedges;
— an increase of $164 million due to prepaid software for services contracts
($94 million) and maintenance agreements ($70 million);
— an increase of $170 million in prepaid taxes;
— an increase of $128 million in deferred services arrangements transi-
tion costs; and
— approximately $158 million currency impact.
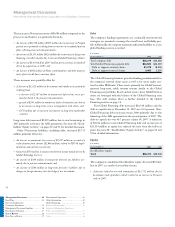
Current liabilities increased $4,220 million as a result of:
U An increase of $3,333 million in Short-term debt primarily driven by
increases in commercial paper;
U An increase of $1,215 million in Deferred income mainly driven by
Software ($502 million) and Global Technology Services ($543 million);
subject to an adjustment based on the volume weighted average price
of the shares during this period and this adjustment will be recorded
in Stockholders’ equity in the Consolidated Statement of Financial
Position on each of the settlement dates. The first settlement
occurred on September 6, 2007, resulting in a settlement payment by
the company of $151.8 million; the second settlement occurred on
December 5, 2007, resulting in a settlement payment by the com-
pany of $253.1 million. The final settlement is expected to occur in
March 2008.
The ASR transaction was guaranteed by the company and was
executed through IBM International Group (IIG), a wholly owned
foreign subsidiary of the company. The formation of IIG enabled the
company to create a centralized foreign holding subsidiary to own
most of its non-U.S. operations. IIG funded the repurchases with $1
billion in cash and an $11.5 billion, 364-day bridge loan with a num-
ber of financial institutions. The bridge loan was guaranteed by the
company and carries an interest rate of the LIBOR plus 10 basis
points. Principal and interest on IIG debt will be paid by IIG with
cash generated by its non-U.S. operating subsidiaries. The execution
of the ASR enabled the company to achieve a substantial share reduc-
tion, a lower cost of capital and an effective use of non-U.S. cash.
In the second half of 2007, IBM International Group Capital
LLC (IIGC), an indirect, wholly owned subsidiary of the company,
issued $4.1 billion in long-term debt and $2.8 billion in commercial
paper. These proceeds were utilized to refinance the bridge loan
associated with the ASR. In addition, approximately $750 million of
the original amount has been repaid. At December 31, 2007, the
outstanding balance of the bridge loan was $3.9 billion.
In addition, on January 29, 2008, IIGC issued $3.5 billion of
18-month floating rate notes. The proceeds will be utilized to further
reduce the bridge loan associated with the ASR.
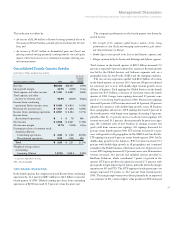
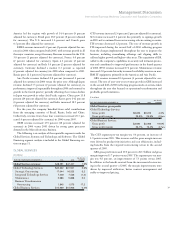
Consistent with retirement and postretirement plan accounting
standards, the company remeasures the funded status of its plans at
December 31. The funded status is measured as the difference between
the fair value of the plan assets and the benefit obligation. The funded
status is recognized in the Consolidated Statement of Financial Posi-
tion. (See note A, “Significant Accounting Policies,” on pages 69 and
70 for additional information). At December 31, 2007, as a result of
the company’s plan contributions, returns on plan assets and changes
in certain retirement plan assumptions, the overall net funded status
improved $7.2 billion from December 31, 2006 to a net over-funded
position of $3.3 billion. This change is primarily reflected in Prepaid
pension assets in the Consolidated Statement of financial position
which increased $6.8 billion from the prior year-end balance.
Management Discussion ............................ 14
Road Map .........................................................14
Forward-Looking and
Cautionary Statements .....................................15
Management Discussion Snapshot ..................16
Description of Business ....................................17
Year in Review ............................................ 23
Prior Year in Review ........................................37
Discontinued Operations .................................42
Other Information ............................................42
Global Financing ..............................................50
Report of Management ....................................56
Report of Independent Registered
Public Accounting Firm ...................................57
Consolidated Statements ..................................58
Notes .................................................................64