IBM 2007 Annual Report Download - page 18
Download and view the complete annual report
Please find page 18 of the 2007 IBM annual report below. You can navigate through the pages in the report by either clicking on the pages listed below, or by using the keyword search tool below to find specific information within the annual report.-
 1
1 -
2
-
3
-
4
-
5
-
6
-
7
-
 8
8 -
 9
9 -
 10
10 -
 11
11 -
 12
12 -
 13
13 -
 14
14 -
 15
15 -
 16
16 -
 17
17 -
 18
18 -
 19
19 -
 20
20 -
 21
21 -
 22
22 -
 23
23 -
 24
24 -
 25
25 -
 26
26 -
 27
27 -
 28
28 -
29
-
30
-
31
-
32
-
33
-
34
-
35
-
36
-
37
-
38
-
39
-
40
-
41
-
42
-
43
-
44
-
45
-
46
-
47
-
48
-
49
-
50
-
51
-
52
-
53
-
54
-
55
-
56
-
57
-
58
-
59
-
60
-
61
-
62
-
63
-
64
-
65
-
66
-
67
-
68
-
69
-
70
-
71
-
72
-
73
-
74
-
75
-
76
-
77
-
78
-
79
-
80
-
81
-
82
-
83
-
84
-
85
-
86
-
87
-
88
-
89
-
90
-
91
-
92
-
93
-
94
-
95
-
96
-
97
-
98
-
99
-
100
-
101
-
102
-
103
-
104
-
105
-
106
-
107
-
108
-
109
-
110
-
111
-
112
-
113
-
114
-
115
-
116
-
117
-
118
-
119
-
120
-
121
-
122
-
123
-
124
-
125
-
126
-
127
-
128
 |
 |

Management Discussion
International Business Machines Corporation and Subsidiary Companies
16
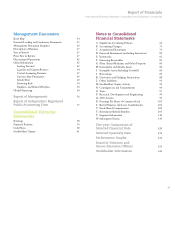
Management Discussion ............................ 14
Road Map .........................................................14
Forward-Looking and
Cautionary Statements .....................................15
Management Discussion Snapshot ............ 16
Description of Business ............................. 17
Year in Review ..................................................23
Prior Year in Review ........................................37
Discontinued Operations .................................42
Other Information ............................................42
Global Financing ..............................................50
Report of Management ....................................56
Report of Independent Registered
Public Accounting Firm ...................................57
Consolidated Statements ..................................58
Notes .................................................................64
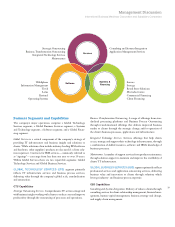
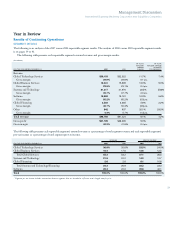
Continuing Operations
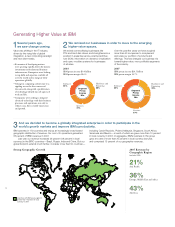
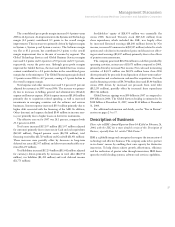
The company’s performance in 2007 reflected the strength of its
global model. Revenue increased in all geographies, with strong
growth in emerging markets worldwide. The company capitalized on
the opportunities in the global economies, generating 63 percent of
its revenue outside the United States, in delivering full-year growth
of 8.1 percent (4 percent adjusted for currency).
Gross profit margins improved reflecting a shift to higher value
offerings and continued benefits from productivity initiatives and the
transformation to a globally integrated enterprise. Pre-tax income
from continuing operations grew 8.8 percent and Net income from
continuing operations increased 10.6 percent versus 2006. Diluted
earnings per share improved 18.5 percent, reflecting the strong
growth in Net income and the benefits of the common stock repur-
chase program. In 2007, the company repurchased approximately
$18.8 billion of its common stock, including a $12.5 billion ASR in
the second quarter.
The increase in 2007 revenue, as compared to 2006, was primarily
due to:
U Strong performance from Global Technology Services and Global Business
Services with growth in all business lines;
U Continued strong demand in the Software business, driven by Key Branded
Middleware products, with positive contributions from strategic acquisi-
tions; and
U Continued growth in emerging countries (Brazil, Russia, India and
China: up 26 percent) and solid performance in all geographies, led by
Asia Pacific.
The increase in Income from continuing operations before income
taxes in 2007 was primarily due to:
U Revenue growth as discussed above; and
U Gross profit margin improvements in the Global Services and Systems
and Technology segments.
Management Discussion Snapshot
($ and shares in millions except per share amounts)
YR .-T O -YR.
PERCENT/
MARGIN
FOR THE YEAR ENDED DECEMBER 31: 2007 2006 CHANGE
Revenue $ 98,786 $ 91,424 8.1%*
Gross profit margin 42.2% 41.9% 0.4 pts.
Total expense and other income $ 27,240 $ 24,978 9.1%
Total expense and other
income-to-revenue ratio 27.6% 27.3% 0.3 pts.
Income from continuing
operations before income taxes $ 14,489 $ 13,317 8.8%
Provision for income taxes $ 4,071 $ 3,901 4.4%
Income from continuing
operations $ 10,418 $ 9,416 10.6%
Net income $ 10,418 $ 9,492 9.7%
Net income margin 10.5% 10.4% 0.2 pts.
Earnings per share of
common stock:
Assuming dilution:
Continuing operations $ 7.18 $ 6.06 18.5%
Discontinued operations (0.00) 0.05 NM
Total $ 7.18 $ 6.11 17.5%
Weighted-average shares
outstanding:
Diluted 1,450.6 1,553.5 (6.6)%
Assets** $120,431 $103,234 16.7%
Liabilities** $ 91,962 $ 74,728 23.1%
Equity** $ 28,470 $ 28,506 (0.1)%
* 4.2 percent adjusted for currency.
** At December 31.
NM — Not meaningful