IBM 2007 Annual Report Download - page 32
Download and view the complete annual report
Please find page 32 of the 2007 IBM annual report below. You can navigate through the pages in the report by either clicking on the pages listed below, or by using the keyword search tool below to find specific information within the annual report.-
 1
1 -
2
-
3
-
4
-
5
-
6
-
7
-
8
-
9
-
10
-
11
-
12
-
13
-
14
-
15
-
16
-
17
-
18
-
19
-
20
-
21
-
 22
22 -
 23
23 -
 24
24 -
 25
25 -
 26
26 -
 27
27 -
 28
28 -
 29
29 -
 30
30 -
 31
31 -
 32
32 -
 33
33 -
 34
34 -
 35
35 -
 36
36 -
 37
37 -
 38
38 -
 39
39 -
 40
40 -
 41
41 -
 42
42 -
43
-
44
-
45
-
46
-
47
-
48
-
49
-
50
-
51
-
52
-
53
-
54
-
55
-
56
-
57
-
58
-
59
-
60
-
61
-
62
-
63
-
64
-
65
-
66
-
67
-
68
-
69
-
70
-
71
-
72
-
73
-
74
-
75
-
76
-
77
-
78
-
79
-
80
-
81
-
82
-
83
-
84
-
85
-
86
-
87
-
88
-
89
-
90
-
91
-
92
-
93
-
94
-
95
-
96
-
97
-
98
-
99
-
100
-
101
-
102
-
103
-
104
-
105
-
106
-
107
-
108
-
109
-
110
-
111
-
112
-
113
-
114
-
115
-
116
-
117
-
118
-
119
-
120
-
121
-
122
-
123
-
124
-
125
-
126
-
127
-
128
 |
 |

Management Discussion
International Business Machines Corporation and Subsidiary Companies
30
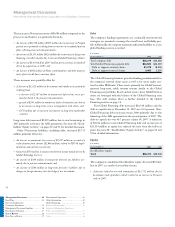
Stock-Based Compensation
Total pre-tax stock-based compensation cost of $713 million decreased
$134 million compared to 2006. The decrease was principally the
result of a reduction in the level of stock option grants ($159 million),
offset by an increase related to restricted and performance-based
stock units ($25 million). The effects of stock-based compensation
cost related to the divestiture of the printing business (a decrease of
$1 million) were included in Other (income) and expense in the
Consolidated Statement of Earnings. The year-to-year reductions in
pre-tax stock-based compensation cost were reflected in the following
categories: Cost ($50 million); SG&A expense ($61 million); RD&E
expense ($21 million) and Other (income) and expense ($1 million).
There was no significant capitalized stock-based compensation
cost at December 31, 2007 and 2006.
See note T, “Stock-Based Compensation,” on pages 102 to 105
for additional information on the company’s stock-based incentive
awards.
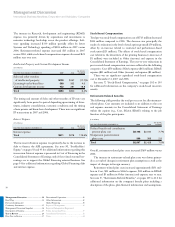
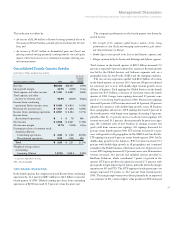
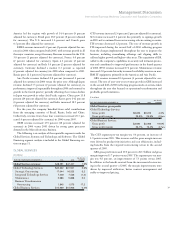
Retirement-Related Benefits
The following table provides the total pre-tax cost for all retirement-
related plans. Cost amounts are included as an addition to the cost
and expense amounts in the Consolidated Statement of Earnings
within the caption (e.g., Cost, SG&A, RD&E) relating to the job
function of the plan participants.
($ in millions)
YR.-TO-YR.
FOR THE YEAR ENDED DECEMBER 31: 2007 2006 CHANGE
Defined benefit and contribution
pension plans cost $2,198 $2,040 7.7%
Nonpension postretirement
plans costs 399 388 2.8
Total $2,597 $2,428 7.0%
Overall, retirement-related plan costs increased $169 million versus
2006.
The increase in retirement-related plan costs was driven primar-
ily as a result of changes in retirement plan assumptions as well as the
impact of changes in foreign currency.
Retirement-related plan costs increased approximately $131 mil-
lion in Cost, $21 million in SG&A expense, $13 million in RD&E
expense and $5 million in Other (income) and expense year to year.
See note U, “Retirement-Related Benefits,” on pages 105 to 116 for
additional information on the company’s benefit plans including a
description of the plans, plan financial information and assumptions.
The increase in Research, development and engineering (RD&E)
expense was primarily driven by acquisitions and investments to
maintain technology leadership across the product offerings. Soft-
ware spending increased $339 million partially offset by lower
Systems and Technology spending of $204 million in 2007 versus
2006. Retirement-related expense increased $13 million in 2007
versus 2006, while stock-based compensation expense decreased $21
million year over year.
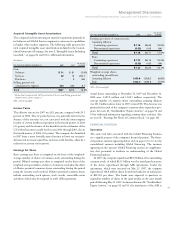
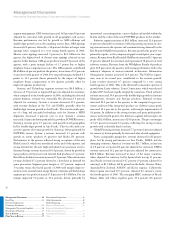
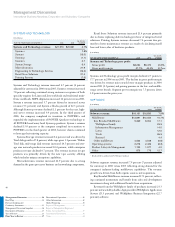
Intellectual Property and Custom Development Income
($ in millions)
YR.-TO-YR.
FOR THE YEAR ENDED DECEMBER 31: 2007 2006 CHANGE
Sales and other transfers
of intellectual property $138 $167 (17.7)%
Licensing/royalty-based fees 368 352 4.6
Custom development income 452 381 18.8
Total $958 $900 6.4%
The timing and amount of Sales and other transfers of IP may vary
significantly from period to period depending upon timing of dives-
titures, industry consolidation, economic conditions and the timing
of new patents and know-how development. There were no significant
IP transactions in 2007 and 2006.
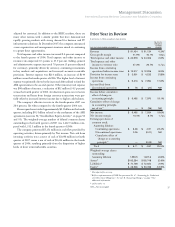
Interest Expense
($ in millions)
YR.-TO-YR.
FOR THE YEAR ENDED DECEMBER 31: 2007 2006 CHANGE
Interest expense:
Total $611 $278 119.6%
The increase in Interest expense was primarily due to the increase in
debt to finance the ASR agreements. See note M, “Stockholders’
Equity,” on pages 92 and 93 for additional information regarding this
transaction. Interest expense is presented in Cost of Financing in the
Consolidated Statement of Earnings only if the related external bor-
rowings are to support the Global Financing external business. See
page 54 for additional information regarding Global Financing debt
and interest expense.
Management Discussion ............................ 14
Road Map .........................................................14
Forward-Looking and
Cautionary Statements .....................................15
Management Discussion Snapshot ..................16
Description of Business ....................................17
Year in Review ............................................ 23
Prior Year in Review ........................................37
Discontinued Operations .................................42
Other Information ............................................42
Global Financing ..............................................50
Report of Management ....................................56
Report of Independent Registered
Public Accounting Firm ...................................57
Consolidated Statements ..................................58
Notes .................................................................64