IBM 2007 Annual Report Download - page 114
Download and view the complete annual report
Please find page 114 of the 2007 IBM annual report below. You can navigate through the pages in the report by either clicking on the pages listed below, or by using the keyword search tool below to find specific information within the annual report.-
 1
1 -
2
-
3
-
4
-
5
-
6
-
7
-
8
-
9
-
10
-
11
-
12
-
13
-
14
-
15
-
16
-
17
-
18
-
19
-
20
-
21
-
22
-
23
-
24
-
25
-
26
-
27
-
28
-
29
-
30
-
31
-
32
-
33
-
34
-
35
-
36
-
37
-
38
-
39
-
40
-
41
-
42
-
43
-
44
-
45
-
46
-
47
-
48
-
49
-
50
-
51
-
52
-
53
-
54
-
55
-
56
-
57
-
58
-
59
-
60
-
61
-
62
-
63
-
64
-
65
-
66
-
67
-
68
-
69
-
70
-
71
-
72
-
73
-
74
-
75
-
76
-
77
-
78
-
79
-
80
-
81
-
82
-
83
-
84
-
85
-
86
-
87
-
88
-
89
-
90
-
91
-
92
-
93
-
94
-
95
-
96
-
97
-
98
-
99
-
100
-
101
-
102
-
103
-
 104
104 -
 105
105 -
 106
106 -
 107
107 -
 108
108 -
 109
109 -
 110
110 -
 111
111 -
 112
112 -
 113
113 -
 114
114 -
 115
115 -
 116
116 -
 117
117 -
 118
118 -
 119
119 -
 120
120 -
 121
121 -
 122
122 -
 123
123 -
 124
124 -
125
-
126
-
127
-
128
 |
 |

112
Notes to Consolidated Financial Statements
International Business Machines Corporation and Subsidiary Companies
Management Discussion ..................................14
Consolidated Statements ..................................14
Notes ........................................................... 64
A-F ...................................................................64
G-M ..................................................................84
N-S ...................................................................94
T-W ........................................................... 102
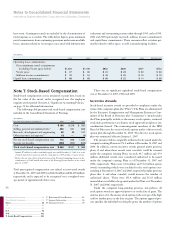
T. Stock-Based Compensation ......................102
U. Retirement-Related Benefits .............. 105
V. Segment Information ................................116
W. Subsequent Events ....................................119
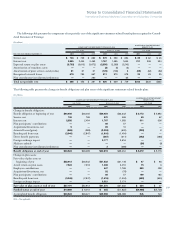
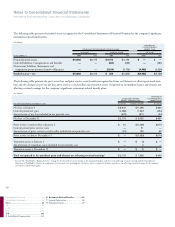
For the PPP, the changes in discount rate assumptions impacted
both net periodic cost and the PBO. For purposes of measuring the
net periodic cost for the years ended December 31, 2007, 2006 and
2005, the changes in discount rate assumptions resulted in a decrease
in the 2007 net periodic cost of $92 million and an increase in the 2006
and 2005 net periodic cost of $94 million and $90 million, respectively.
For purposes of measuring the PBO, the changes in discount rate
assumptions resulted in a decrease in the PBO of $1,185 million and
$1,240 million at December 31, 2007 and 2006, respectively.
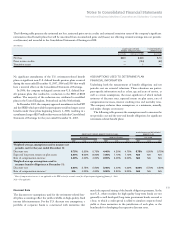
For the significant non-U.S. defined benefit pension plans, the
changes in discount rate assumptions resulted in an increase in the
2007 and 2006 net periodic cost of $30 million and $274 million,
respectively. Changes in discount rate assumptions had no material
impact on the 2005 net periodic cost.
For the U.S. nonpension postretirement benefit plan, the changes
in discount rate assumptions had no material impact on net periodic
cost for the years ended December 31, 2007, 2006 and 2005 and on
the APBO at December 31, 2007 and 2006.
Expected Long-Term Returns on Plan Assets
The expected long-term return on plan assets assumption takes into
account long-term expectations for future returns, investment strat-
egy and the market-related value of plan assets. The market-related
value of plan assets is a calculated value, in accordance with account-
ing guidance, that recognizes changes in the fair value of plan assets
in a systematic manner over five years. The rates of expected return
are developed by the company in conjunction with external advisors,
are calculated using an arithmetic average and are tested for reason-
ableness against the historical return average by asset category, usually
over a 10-year period. The use of expected long-term returns on plan
assets may result in recognized pension income that is greater or less
than the actual returns of those plan assets in any given year. Over
time, however, the expected long-term returns are designed to
approximate the actual long-term returns and therefore result in a
pattern of income and expense recognition that more closely matches
the pattern of the services provided by the employees. Differences
between actual and expected returns are recognized over five years in
the expected return on plan assets line in net periodic cost and also
as a component of net loss or gain in the Accumulated gains and
(losses) not affecting retained earnings, which is recognized over the
service lives of the employees in the plan, provided such amounts
exceed thresholds which are based upon the obligation or the value
of plan assets, as provided by accounting standards.
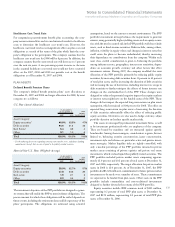
For the PPP, the expected long-term return on plan assets of 8.00
percent remained constant for the years ended December 31, 2007,
2006 and 2005 and, consequently, had no incremental impact on net
periodic cost.
For the material non-U.S. defined benefit pension plans, the
changes in the expected long-term return on plan assets resulted in
an increase in the 2007, 2006 and 2005 net periodic cost of $50 mil-
lion, $18 million and $140 million, respectively.
For the U.S. nonpension postretirement benefit plan, the company
maintains a nominal, highly liquid trust fund balance to ensure pay-
ments are made timely. As a result, for the years ended December 31,
2007, 2006 and 2005, the expected long-term return on plan assets
and the actual return on those assets were not material.
Rate of Compensation Increases and Mortality Rate
The rate of compensation increases is determined by the company,
based upon its long-term plans for such increases. Mortality rate
assumptions are based on life expectancy and death rates for different
types of participants. Mortality rates are periodically updated based
on actual experience. Changes to defined benefit pension plans mor-
tality rate assumptions increased the 2007 and 2006 net periodic cost
approximately $80 million and $55 million, respectively, and increased
the 2007 benefit obligation approximately $790 million. Changes to
the rate of compensation increases had no material impact on the
2007 net periodic cost and reduced the 2006 net periodic cost approx-
imately $32 million. Changes to the rate of compensation increases
or to mortality rate assumptions had no material impact on the 2005
net periodic cost and on benefit obligations at December 31, 2006.
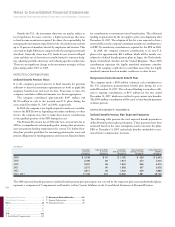
Interest Crediting Rate
Benefits for certain participants in the PPP are calculated using a
cash balance formula. An assumption underlying this formula is an
interest crediting rate, which impacts both net periodic cost and the
PBO. This assumption provides a basis for projecting the expected
interest rate that participants will earn on the benefits that they are
expected to receive in the following year and is based on the average
from August to October of the one-year U.S. Treasury Constant
Maturity yield plus one percent.
For the PPP, the change in the interest crediting rate to 6.0 per-
cent for the year ended December 31, 2007 from 5.0 percent for the
year ended December 31, 2006 resulted in an increase in the 2007 net
periodic cost of $125 million. The change in the interest crediting
rate to 5.0 percent for the year ended December 31, 2006 from 3.1
percent for the year ended December 31, 2005 resulted in an increase
in the 2006 net periodic cost of $170 million. The change in the
interest crediting rate to 3.1 percent for the year ended December 31,
2005 from 2.3 percent for the year ended December 31, 2004
resulted in an increase in the 2005 net periodic cost of $55 million.