IBM 2007 Annual Report Download - page 29
Download and view the complete annual report
Please find page 29 of the 2007 IBM annual report below. You can navigate through the pages in the report by either clicking on the pages listed below, or by using the keyword search tool below to find specific information within the annual report.-
 1
1 -
2
-
3
-
4
-
5
-
6
-
7
-
8
-
9
-
10
-
11
-
12
-
13
-
14
-
15
-
16
-
17
-
18
-
 19
19 -
 20
20 -
 21
21 -
 22
22 -
 23
23 -
 24
24 -
 25
25 -
 26
26 -
 27
27 -
 28
28 -
 29
29 -
 30
30 -
 31
31 -
 32
32 -
 33
33 -
 34
34 -
 35
35 -
 36
36 -
 37
37 -
 38
38 -
 39
39 -
40
-
41
-
42
-
43
-
44
-
45
-
46
-
47
-
48
-
49
-
50
-
51
-
52
-
53
-
54
-
55
-
56
-
57
-
58
-
59
-
60
-
61
-
62
-
63
-
64
-
65
-
66
-
67
-
68
-
69
-
70
-
71
-
72
-
73
-
74
-
75
-
76
-
77
-
78
-
79
-
80
-
81
-
82
-
83
-
84
-
85
-
86
-
87
-
88
-
89
-
90
-
91
-
92
-
93
-
94
-
95
-
96
-
97
-
98
-
99
-
100
-
101
-
102
-
103
-
104
-
105
-
106
-
107
-
108
-
109
-
110
-
111
-
112
-
113
-
114
-
115
-
116
-
117
-
118
-
119
-
120
-
121
-
122
-
123
-
124
-
125
-
126
-
127
-
128
 |
 |

Management Discussion
International Business Machines Corporation and Subsidiary Companies
27
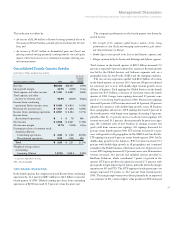
Software segment revenue of $19,982 million increased 10.0 percent
(6 percent adjusted for currency) in 2007 reflecting strong demand
for the Key Branded Middleware products. Revenue performance was
led by double-digit growth in the Financial Services, Public and Small
and Medium Business sectors. Clients are using IBM middleware to
effectively improve their operating leverage and business efficiency.
Revenue from Key Branded Middleware, which includes
WebSphere, Information Management, Lotus, Tivoli and Rational
products, was $10.8 billion, up 15.5 percent (11 percent adjusted for
currency) and increased 3 points to 54 percent of total Software seg-
ment revenue. The company has invested heavily in these products,
through internal investments and targeted acquisitions, and expects
the majority of its software revenue growth to come from this por-
tion of the product portfolio.
Revenue from the WebSphere Family of products increased 19.1
percent (14 percent adjusted for currency) and was led by double-
digit growth in WebSphere Application Servers and WebSphere
Business Integration software. The strong revenue performance
reflects the industry’s adoption of SOA. The WebSphere products
provide the foundation for Web-enabled applications and are a key
product set in deploying a client’s SOA.
Information Management revenue increased 14.7 percent (10 per-
cent adjusted for currency) in 2007 versus the prior year. Information
Management software enables clients to leverage Information on
Demand. The acquisition of FileNet, in the fourth quarter of 2006,
contributed strong revenue growth throughout the year. The Cognos
acquisition, completed in the first quarter of 2008, will provide a
strong entry in the Business Intelligence marketplace and is expected
to provide synergies in software, services, servers and storage.
Lotus revenue increased 8.7 percent (4 percent adjusted for cur-
rency) in 2007 driven by the Notes/Domino family of products.
Lotus software is well established as a tool for providing improved
workplace collaboration and productivity. Lotus Connections,
released in the second quarter, has been rapidly adapted by customers.
The latest version of Lotus Notes, Lotus Notes 8.0, was delivered in
the third quarter of 2007.
Revenue from Tivoli software, infrastructure software that enables
clients to centrally manage networks including security and storage
capability, increased 18.0 percent (13 percent adjusted for currency)
with double-digit growth in each segment of the portfolio, Systems
Management, Security and Storage. The acquisitions of MRO, in the
fourth quarter of 2006, and Vallent and Consul, in the first quarter
of 2007, also contributed to the brand’s revenue growth.
Rational revenue increased 13.7 percent (9 percent adjusted for
currency) in 2007 which reflected strong customer acceptance of the
integrated product set. Rational provides integrated tools to improve
the software development process for clients. The closing of the
Telelogic acquisition is conditioned upon satisfactory completion of
regulatory reviews in the European Union. Telelogic’s suite of system
programming tools complements Rational’s IT tool set, providing a
complete tooling solution across a client’s enterprise.
Revenue from Other middleware products increased 3.5 percent
(flat adjusted for currency) in 2007 versus the prior year. This soft-
ware product set includes more mature products which provide a
more stable flow of revenue.
Operating Systems revenue increased 2.0 percent (decreased 2 per-
cent adjusted for currency) in 2007 versus 2006.
Product Lifecycle Management (PLM) revenue decreased 6.4
percent (11 percent adjusted for currency) in 2007 driven by declines
in the Small and Medium Business sector. PLM software helps com-
panies improve their product development processes and their ability
to use product-related information across their businesses.
Other software segment revenue increased 26.7 percent (22 percent
adjusted for currency) versus 2006 reflecting growth in software-related
services, such as consulting and education.
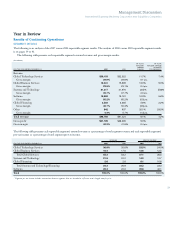
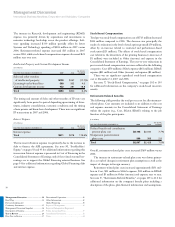
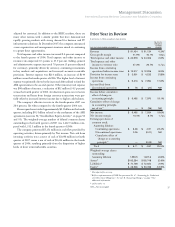
($ in millions)
YR.-TO-YR.
FOR THE YEAR ENDED DECEMBER 31: 2007 2006 CHANGE
Software gross profit:
Gross profit $17,015 $15,471 10.0%
Gross profit margin 85.2% 85.2% 0.0 pts.
Software segment gross profit increased 10.0 percent to $17.0 billion
in 2007, driven primarily by strong revenue growth. Gross profit
margin was 85.2 percent in 2007, flat versus the prior year.
The Software segment contributed $6.0 billion of pre-tax profit
in 2007, an increase of 9.3 percent versus 2006. The segment pre-tax
profit margin of 26.8 percent was essentially flat (declined 0.1 pt) ver-
sus the prior year, reflecting the integration of acquired businesses.
Global Financing
See page 51 for an analysis of Global Financing’s revenue and gross
profit.
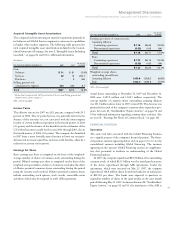
Geographic Revenue
In addition to the revenue presentation by reportable segment, the
company also measures revenue performance on a geographic basis.