IBM 2007 Annual Report Download - page 111
Download and view the complete annual report
Please find page 111 of the 2007 IBM annual report below. You can navigate through the pages in the report by either clicking on the pages listed below, or by using the keyword search tool below to find specific information within the annual report.-
 1
1 -
2
-
3
-
4
-
5
-
6
-
7
-
8
-
9
-
10
-
11
-
12
-
13
-
14
-
15
-
16
-
17
-
18
-
19
-
20
-
21
-
22
-
23
-
24
-
25
-
26
-
27
-
28
-
29
-
30
-
31
-
32
-
33
-
34
-
35
-
36
-
37
-
38
-
39
-
40
-
41
-
42
-
43
-
44
-
45
-
46
-
47
-
48
-
49
-
50
-
51
-
52
-
53
-
54
-
55
-
56
-
57
-
58
-
59
-
60
-
61
-
62
-
63
-
64
-
65
-
66
-
67
-
68
-
69
-
70
-
71
-
72
-
73
-
74
-
75
-
76
-
77
-
78
-
79
-
80
-
81
-
82
-
83
-
84
-
85
-
86
-
87
-
88
-
89
-
90
-
91
-
92
-
93
-
94
-
95
-
96
-
97
-
98
-
99
-
100
-
 101
101 -
 102
102 -
 103
103 -
 104
104 -
 105
105 -
 106
106 -
 107
107 -
 108
108 -
 109
109 -
 110
110 -
 111
111 -
 112
112 -
 113
113 -
 114
114 -
 115
115 -
 116
116 -
 117
117 -
 118
118 -
 119
119 -
 120
120 -
 121
121 -
122
-
123
-
124
-
125
-
126
-
127
-
128
 |
 |

109
Notes to Consolidated Financial Statements
International Business Machines Corporation and Subsidiary Companies
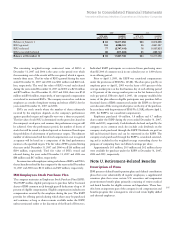
The following table presents the components of net periodic cost of the significant retirement-related benefit plans recognized in Consoli-
dated Statement of Earnings:
($ in millions)
NONPENSION POSTRETIREMENT
SIGNIFICANT DEFINED BENEFIT PENSION PLANS BENEFIT PLAN
U.S. PLAN NON-U.S. PLANS U.S. PLAN
FOR THE YEAR ENDED DECEMBER 31: 2007 2006 2005 2007 2006 2005 2007 2006 2005
Service cost $ 746 $ 769 $ 682 $ 570 $ 596 $ 694 $ 69 $ 62 $ 45
Interest cost 2,585 2,454 2,463 1,767 1,585 1,635 311 306 324
Expected return on plan assets (3,703) (3,613) (3,672) (2,500) (2,298) (2,245) — — —
Amortization of transition assets — — — (3) (6) (6) — — —
Amortization of prior service costs/(credits) 61 61 61 (125) (108) 8 (62) (62) (62)
Recognized actuarial losses 679 785 567 911 870 578 24 29 25
Plan amendments/curtailments/settlements — — 280 — — 65 — — —
Total net periodic cost $ 368 $ 456 $ 381 $ 620 $ 639 $ 729 $342 $335 $332
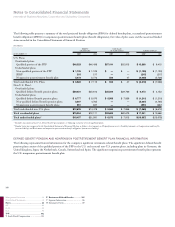
The following table presents the changes in benefit obligations and plan assets of the significant retirement-related benefit plans:
($ in millions)
NONPENSION POSTRETIREMENT
SIGNIFICANT DEFINED BENEFIT PENSION PLANS BENEFIT PLAN
U.S. PLAN NON-U.S. PLANS U.S. PLAN
2007 2006 2007 2006 2007 2006
Change in benefit obligation:
Benefit obligation at beginning of year $46,498 $46,405 $39,454 $36,643 $ 5,773 $ 5,892
Service cost 746 769 570 596 69 62
Interest cost 2,585 2,454 1,767 1,585 311 306
Plan participants’ contributions — — 66 57 — —
Acquisitions/divestitures, net 5 — 85 10 — —
Actuarial losses/(gains) (465) (283) (2,324) (600) (203) 8
Benefits paid from trust (3,046) (2,847) (1,616) (1,454) — —
Direct benefit payments — — (367) (311) (442) (486)
Foreign exchange impact — — 3,177 3,616 — —
Medicare subsidy — — — — (36) (9)
Plan amendments/curtailments/settlements — — 3 (688) — —
Benefit obligation at end of year $46,323 $46,498 $40,815 $39,454 $ 5,472 $ 5,773
Change in plan assets:
Fair value of plan assets at
beginning of year $52,913 $48,542 $37,632 $31,148 $ 47 $ 66
Actual return on plan assets 7,324 7,218 1,468 3,016 15 3
Employer contributions — — 447 1,769 893 438
Acquisitions/divestitures, net — — 52 (78) — —
Plan participants’ contributions — — 66 57 199 185
Benefits paid from trust (3,046) (2,847) (1,616) (1,454) (650) (645)
Foreign exchange impact — — 3,021 3,174 — —
Fair value of plan assets at end of year $57,191 $52,913 $41,070 $37,632 $ 504 $ 47
Funded status at end of year $10,868 $ 6,415 $ 255 $ (1,822) $(4,968) $(5,726)
Accumulated benefit obligation $46,323 $46,421 $39,396 $38,088 N/A N/A
N/A — Not applicable