IBM 2007 Annual Report Download - page 40
Download and view the complete annual report
Please find page 40 of the 2007 IBM annual report below. You can navigate through the pages in the report by either clicking on the pages listed below, or by using the keyword search tool below to find specific information within the annual report.-
 1
1 -
2
-
3
-
4
-
5
-
6
-
7
-
8
-
9
-
10
-
11
-
12
-
13
-
14
-
15
-
16
-
17
-
18
-
19
-
20
-
21
-
22
-
23
-
24
-
25
-
26
-
27
-
28
-
29
-
 30
30 -
 31
31 -
 32
32 -
 33
33 -
 34
34 -
 35
35 -
 36
36 -
 37
37 -
 38
38 -
 39
39 -
 40
40 -
 41
41 -
 42
42 -
 43
43 -
 44
44 -
 45
45 -
 46
46 -
 47
47 -
 48
48 -
 49
49 -
 50
50 -
51
-
52
-
53
-
54
-
55
-
56
-
57
-
58
-
59
-
60
-
61
-
62
-
63
-
64
-
65
-
66
-
67
-
68
-
69
-
70
-
71
-
72
-
73
-
74
-
75
-
76
-
77
-
78
-
79
-
80
-
81
-
82
-
83
-
84
-
85
-
86
-
87
-
88
-
89
-
90
-
91
-
92
-
93
-
94
-
95
-
96
-
97
-
98
-
99
-
100
-
101
-
102
-
103
-
104
-
105
-
106
-
107
-
108
-
109
-
110
-
111
-
112
-
113
-
114
-
115
-
116
-
117
-
118
-
119
-
120
-
121
-
122
-
123
-
124
-
125
-
126
-
127
-
128
 |
 |

Management Discussion
International Business Machines Corporation and Subsidiary Companies
38
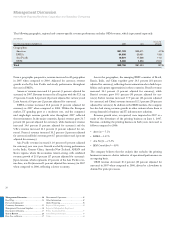
Continuing Operations
The company’s 2006 performance was the result of a series of actions
taken over the last several years to steadily transform the company.
The company has divested of businesses that are commoditizing, while
investing in targeted acquisitions to continue to build capabilities in
higher value areas. The company has also been focused on increasing
productivity, to expand margins and improve efficiency. In addition,
it has accelerated its move to become a globally integrated company.
These actions have resulted in a more balanced mix of businesses and a
stronger, more competitive and sustainable global business. The com-
pany’s 2006 financial results reflected this improved business model.
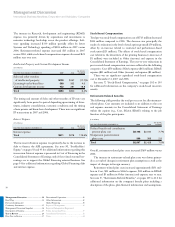
The company divested its Personal Computing business on April
30, 2005. Therefore, the reported results for 2006 did not include any
activity for the Personal Computing Division, while the results for
2005 included four months of activity. This lack of comparable periods
had a material impact on the company’s reported revenue growth.
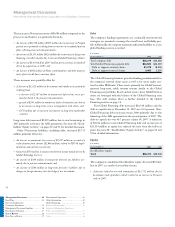
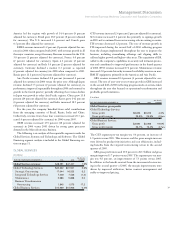
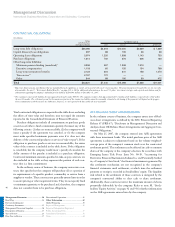
Total revenue, as reported, increased 0.3 percent versus 2005;
excluding the Personal Computing business external revenue from
2005, total 2006 revenue increased 3.6 percent (3.2 percent adjusted
for currency). Pre-tax income from continuing operations grew 8.9
percent, while diluted earnings per share from continuing operations
increased 23.4 percent compared to 2005. Income from continuing
operations increased 17.8 percent compared to 2005, benefiting from
a 5.3 point improvement in the effective tax rate year to year.
The increased revenue, excluding the Personal Computing busi-
ness, in 2006 as compared to 2005, was primarily due to:
U Improved demand in the Software business, driven by Key Branded
Middleware products, with positive contributions from key acquisitions;
U Increased demand in the Systems and Technology business driven by Micro-
electronics, System z and Storage; growth in System x and Retail Store
Solutions; and
U Continued growth in the emerging countries, Brazil, Russia, India and
China, (up 21 percent) and solid performance in the Americas and
EMEA geographies.
The increased income from continuing operations before income
taxes in 2006 as compared to 2005 was primarily due to:
U Revenue growth in the Software segment as discussed above;
U Continued execution of the company’s productivity initiatives driving
improved Global Services gross margins; and
U Revenue growth and continued operational improvement in the Micro-
electronics business.
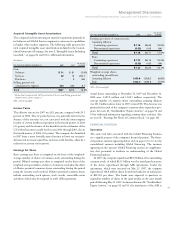
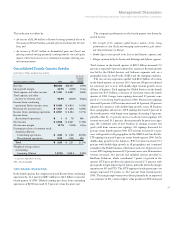
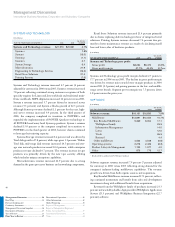
Total revenue, as reported, increased 0.3 percent (flat adjusted for
currency) versus 2005. From a geographic perspective, as-reported
revenue performance was mixed in 2006 compared to 2005, with
growth in the Americas and EMEA, being offset by decreased reve-
nue in Asia Pacific.
Americas’ revenue increased 1.8 percent (1 percent adjusted for
currency) in 2006 versus 2005 and increased in all regions with the
U.S. up 1.0 percent, Canada 2.4 percent (decreased 4 percent adjusted
for currency) and Latin America 8.6 percent (3 percent adjusted
for currency).
EMEA revenue increased 0.2 percent on an as-reported basis
(declined 1 percent adjusted for currency) in 2006 when compared to
2005. In the major countries, the U.K. increased 0.5 percent (decreased
1 percent adjusted for currency), France increased 1.6 percent (flat
adjusted for currency), Italy increased 1.6 percent (flat adjusted for
currency) and Spain increased 2.1 percent (flat adjusted for cur-
rency). Revenue in Germany declined 2.8 percent (4 percent adjusted
for currency) year to year.
Asia Pacific revenue declined 5.7 percent (3 percent adjusted for
currency) year over year. Japan, which represented over 50 percent of
the Asia Pacific revenue base, declined 10.1 percent (5 percent adjusted
for currency). The Japan revenue decline was partially offset by
increased revenue in Korea (12.6 percent) and India (22.9 percent).
The emerging countries of Brazil, Russia, India and China
together grew 9.9 percent (5 percent adjusted for currency) as the
company continued to invest to build capabilities in these countries.
Brazil grew 15.4 percent (4 percent adjusted for currency), Russia
increased 13.9 percent (14 percent adjusted for currency) and India
increased 22.9 percent (26 percent adjusted for currency). China
declined 0.3 percent (2 percent adjusted for currency) as performance
was significantly impacted by the Personal Computing divestiture.
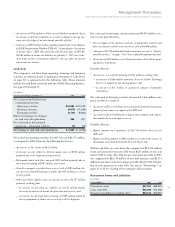
OEM revenue increased 17.9 percent (18 percent adjusted for
currency) in 2006 driven by strong demand for game processors in
the Microelectronics business.
The company believes that a more appropriate revenue analysis is
one that excludes the revenue results of the Personal Computing
Division in 2005 because it presents results on a comparable basis
and provides a more meaningful focus on the company’s ongoing
operational performance.
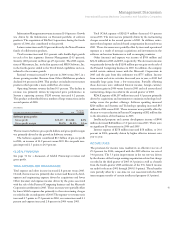
Total revenue, excluding the divested Personal Computing busi-
ness, increased 3.6 percent (3.2 percent adjusted for currency) versus
2005. Adjusted for currency, revenue increased in all geographic
markets with the strongest growth coming from the Americas.
Americas’ revenue grew 4.7 percent as reported (4 percent
adjusted for currency), with growth in all regions. From a product
perspective, the increased revenue was driven by software. Latin
Management Discussion ............................ 14
Road Map .........................................................14
Forward-Looking and
Cautionary Statements .....................................15
Management Discussion Snapshot ..................16
Description of Business ....................................17
Year in Review ..................................................23
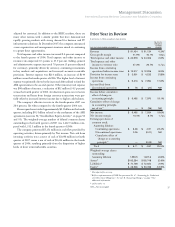
Prior Year in Review .................................. 37
Discontinued Operations .................................42
Other Information ............................................42
Global Financing ..............................................50
Report of Management ....................................56
Report of Independent Registered
Public Accounting Firm ...................................57
Consolidated Statements ..................................58
Notes .................................................................64