IBM 2007 Annual Report Download - page 26
Download and view the complete annual report
Please find page 26 of the 2007 IBM annual report below. You can navigate through the pages in the report by either clicking on the pages listed below, or by using the keyword search tool below to find specific information within the annual report.-
 1
1 -
2
-
3
-
4
-
5
-
6
-
7
-
8
-
9
-
10
-
11
-
12
-
13
-
14
-
15
-
 16
16 -
 17
17 -
 18
18 -
 19
19 -
 20
20 -
 21
21 -
 22
22 -
 23
23 -
 24
24 -
 25
25 -
 26
26 -
 27
27 -
 28
28 -
 29
29 -
 30
30 -
 31
31 -
 32
32 -
 33
33 -
 34
34 -
 35
35 -
 36
36 -
37
-
38
-
39
-
40
-
41
-
42
-
43
-
44
-
45
-
46
-
47
-
48
-
49
-
50
-
51
-
52
-
53
-
54
-
55
-
56
-
57
-
58
-
59
-
60
-
61
-
62
-
63
-
64
-
65
-
66
-
67
-
68
-
69
-
70
-
71
-
72
-
73
-
74
-
75
-
76
-
77
-
78
-
79
-
80
-
81
-
82
-
83
-
84
-
85
-
86
-
87
-
88
-
89
-
90
-
91
-
92
-
93
-
94
-
95
-
96
-
97
-
98
-
99
-
100
-
101
-
102
-
103
-
104
-
105
-
106
-
107
-
108
-
109
-
110
-
111
-
112
-
113
-
114
-
115
-
116
-
117
-
118
-
119
-
120
-
121
-
122
-
123
-
124
-
125
-
126
-
127
-
128
 |
 |

Management Discussion
International Business Machines Corporation and Subsidiary Companies
24
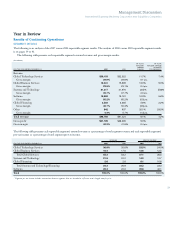
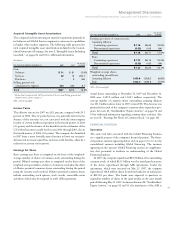
Global Services
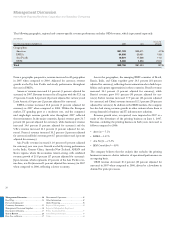
The company’s Global Services segments, Global Technology
Services and Global Business Services had a combined revenue of
$54,144 million, an increase of 12.1 percent (8 percent adjusted for
currency) in 2007 when compared to 2006. The Global Services seg-
ments delivered combined pre-tax profit of $5,622 million, an
increase of 12.6 percent versus the prior year. The company has
made considerable progress implementing its strategies across the
Global Services offerings. These actions have resulted in improved
financial performance with strong and balanced contribution across
all geographies and business lines.
($ in millions)
YR.-TO-YR.
FOR THE YEAR ENDED DECEMBER 31: 2007 2006 CHANGE
Global Services revenue: $54,144 $48,291 12.1%
Global Technology Services $36,103 $32,322 11.7%
Strategic Outsourcing 18,701 17,044 9.7
Integrated Technology Services 8,438 7,448 13.3
Business Transformation
Outsourcing 2,294 1,845 24.4
Maintenance 6,670 5,986 11.4
Global Business Services $18,041 $15,969 13.0%
Global Technology Services (GTS) revenue increased 11.7 percent
(7 percent adjusted for currency) in 2007 versus 2006. The strong
performance reflects the extensive transformation which has occurred
in this business over the past few years. This transformation included
revamping the entire Integrated Technology Services (ITS) portfolio,
continued improvement in Strategic Outsourcing (SO) delivery and
a disciplined approach to driving new business in existing accounts.
Total signings in GTS increased 2 percent, with shorter term signings
growth of 4 percent and 1 percent growth in longer term signings.
SO revenue was up 9.7 percent (5 percent adjusted for currency)
with growth in all geographies, led by Europe/Middle East/Africa
(EMEA) and Asia Pacific. Revenue growth benefited from prior-year
signings, sales of new business in existing accounts, lower base con-
tract erosion and good yield from 2007 signings. SO signings in 2007
decreased 1 percent when compared to 2006.
ITS revenue increased 13.3 percent (9 percent adjusted for cur-
rency) in 2007 versus 2006. Revenue growth was driven primarily by
increased signings and reflects the strength of the ITS portfolio
worldwide. The revamped ITS portfolio includes 10 Service Product
Lines which complement hardware offerings from Systems and
Technology and software offerings from the Software business. The
acquisition of Internet Security Systems (ISS), in the fourth quarter
of 2006, also contributed to the revenue growth this year. ITS sign-
ings increased 4 percent in 2007, with good performance in the key
offerings, including Green Data Center, Server Management Services
and SOA.
Business Transformation Outsourcing (BTO) revenue increased
24.4 percent (20 percent adjusted for currency), with double-digit
growth in all geographies. BTO signings increased 17 percent year
over year.
Maintenance revenue increased 11.4 percent (7 percent adjusted
for currency) driven primarily by increased availability services on
non-IBM IT equipment. Services provided to InfoPrint Solutions,
following the divestiture of the printer business in the second quar-
ter, contributed 4 points of growth.
Global Business Services (GBS) revenue increased 13.0 percent
(9 percent adjusted for currency) in 2007, with balanced growth across
all three geographies. Revenue performance was led by double-digit
growth in application management services offerings and growth in
all consulting service lines. Total signings in GBS increased 1 percent,
led by 5 percent growth in shorter term signings. Longer term sign-
ings decreased 7 percent year over year.
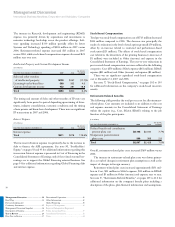
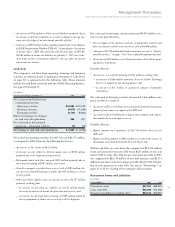
($ in millions)
YR.-TO-YR.
FOR THE YEAR ENDED DECEMBER 31: 2007 2006 CHANGE
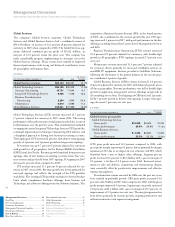
Global Services gross profit:
Global Technology Services:
Gross profit $10,800 $9,623 12.2%
Gross profit margin 29.9% 29.8% 0.1 pts.
Global Business Services:
Gross profit $ 4,240 $3,694 14.8%
Gross profit margin 23.5% 23.1% 0.4 pts.
GTS gross profit increased 12.2 percent compared to 2006, with
gross profit margin improving 0.1 points, driven primarily by margin
expansion in SO due to an improved cost structure and ITS, which
benefited from a mix to higher value offerings. Segment pre-tax
profit increased 8.2 percent to $3.6 billion with a pre-tax margin of
9.4 percent, a decline of 0.2 points versus 2006. Increased invest-
ments in sales and delivery, acquisitions and restructuring charges
were essentially offset by productivity improvements and effective
expense management.
Transformation actions executed by GBS over the past two years
have resulted in profitable growth. GBS gross profit increased 14.8
percent to $4.2 billion in 2007 when compared to 2006, and the gross
profit margin improved 0.4 points. Segment pre-tax profit increased
21.0 percent to $2.1 billion with a pre-tax margin of 10.7 percent, an
improvement of 0.9 points year over year. The margin expansion has
been driven primarily by revenue growth, ongoing productivity and
utilization initiatives and expense management.
Management Discussion ............................ 14
Road Map .........................................................14
Forward-Looking and
Cautionary Statements .....................................15
Management Discussion Snapshot ..................16
Description of Business ....................................17
Year in Review ............................................ 23
Prior Year in Review ........................................37
Discontinued Operations .................................42
Other Information ............................................42
Global Financing ..............................................50
Report of Management ....................................56
Report of Independent Registered
Public Accounting Firm ...................................57
Consolidated Statements ..................................58
Notes .................................................................64