IBM 2007 Annual Report Download - page 54
Download and view the complete annual report
Please find page 54 of the 2007 IBM annual report below. You can navigate through the pages in the report by either clicking on the pages listed below, or by using the keyword search tool below to find specific information within the annual report.-
 1
1 -
2
-
3
-
4
-
5
-
6
-
7
-
8
-
9
-
10
-
11
-
12
-
13
-
14
-
15
-
16
-
17
-
18
-
19
-
20
-
21
-
22
-
23
-
24
-
25
-
26
-
27
-
28
-
29
-
30
-
31
-
32
-
33
-
34
-
35
-
36
-
37
-
38
-
39
-
40
-
41
-
42
-
43
-
 44
44 -
 45
45 -
 46
46 -
 47
47 -
 48
48 -
 49
49 -
 50
50 -
 51
51 -
 52
52 -
 53
53 -
 54
54 -
 55
55 -
 56
56 -
 57
57 -
 58
58 -
 59
59 -
 60
60 -
 61
61 -
 62
62 -
 63
63 -
 64
64 -
65
-
66
-
67
-
68
-
69
-
70
-
71
-
72
-
73
-
74
-
75
-
76
-
77
-
78
-
79
-
80
-
81
-
82
-
83
-
84
-
85
-
86
-
87
-
88
-
89
-
90
-
91
-
92
-
93
-
94
-
95
-
96
-
97
-
98
-
99
-
100
-
101
-
102
-
103
-
104
-
105
-
106
-
107
-
108
-
109
-
110
-
111
-
112
-
113
-
114
-
115
-
116
-
117
-
118
-
119
-
120
-
121
-
122
-
123
-
124
-
125
-
126
-
127
-
128
 |
 |

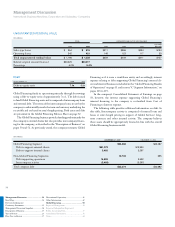
Management Discussion
International Business Machines Corporation and Subsidiary Companies
52
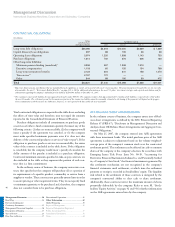
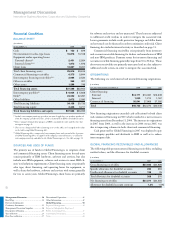
Financial Condition
BALANCE SHEET
($ in millions)
AT DECEMBER 31: 2007 2006
Cash $ 755 $ 879
Net investment in sales-type leases 10,876 10,108
Equipment under operating leases:
External clients
(a) 2,401 2,264
Internal clients
(b) (c) 1,872 1,976
Client loans 10,667 9,267
Total client financing assets 25,816 23,615
Commercial financing receivables 6,375 5,844
Intercompany financing receivables
(b) (c) 2,984 2,534
Other receivables 368 327
Other assets 1,288 746
Total financing assets $37,586 $33,945
Intercompany payables
(b) $ 6,934 $ 5,858
Debt
(d) 24,532 22,287
Other liabilities 2,672 2,590
Total financing liabilities 34,138 30,735
Total financing equity 3,448 3,211
Total financing liabilities and equity $37,586 $33,945
(a) Includes intercompany mark-up, priced on an arms-length basis, on products purchased
from the company’s product divisions, which is eliminated in IBM’s consolidated results.
(b) Entire amount eliminated for purposes of IBM’s consolidated results and therefore does
not appear on page 59.
(c) These assets, along with all other financing assets in this table, are leveraged at the value
in the table using Global Financing debt.
(d) Global Financing debt is comprised of intercompany loans and external debt. A portion
of Global Financing debt is in support of the company’s internal business, or related to
intercompany mark-up embedded in the Global Financing assets. See table on page 54.
SOURCES AND USES OF FUNDS
The primary use of funds in Global Financing is to originate client
and commercial financing assets. Client financing assets for end users
consist primarily of IBM hardware, software and services, but also
include non-IBM equipment, software and services to meet IBM cli-
ents’ total solutions requirements. Client financing assets are primarily
sales type, direct financing, and operating leases for equipment, as
well as loans for hardware, software and services with terms generally
for two to seven years. Global Financing’s client loans are primarily
for software and services and are unsecured. These loans are subjected
to additional credit analysis in order to mitigate the associated risk.
Loan agreements include credit protective language and dollar limits
on how much can be financed in order to minimize credit risk. Client
financing also includes internal activity as described on page 51.
Commercial financing receivables arise primarily from inventory
and accounts receivable financing for dealers and remarketers of IBM
and non-IBM products. Payment terms for inventory financing and
accounts receivable financing generally range from 30 to 90 days. These
short-term receivables are primarily unsecured and are also subject to
additional credit actions in order to mitigate the associated risk.
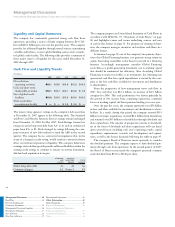
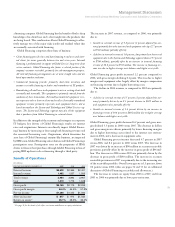
ORIGINATIONS
The following are total external and internal financing originations.
($ in millions)
FOR THE YEAR ENDED DECEMBER 31: 2007 2006 2005
Client financing:
External $14,171 $13,087 $12,249
Internal 1,040 1,214 1,167
Commercial financing 30,541 27,969 27,032
Total $45,752 $42,270 $40,448
New financing originations exceeded cash collections for both client
and commercial financing in 2007, which resulted in a net increase in
financing assets from December 31, 2006. The increase in originations
in 2007 from 2006, as well as the increase in 2006 versus 2005, was
due to improving volumes in both client and commercial financing.
Cash generated by Global Financing in 2007 was deployed to pay
intercompany payables and dividends to IBM as well as to reduce
intercompany debt.
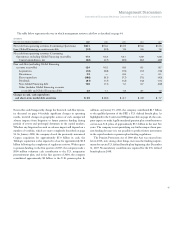
GLOBAL FINANCING RECEIVABLES AND ALLOWANCES
The following table presents external financing receivables, excluding
residual values, and the allowance for doubtful accounts.
($ in millions)
AT DECEMBER 31: 2007 2006
Gross financing receivables $27,642 $24,926
Specific allowance for doubtful accounts 230 294
Unallocated allowance for doubtful accounts 138 76
Total allowance for doubtful accounts 368 370
Net financing receivables $27,274 $24,556
Allowance for doubtful account coverage 1.3% 1.5%
Management Discussion ............................ 14
Road Map .........................................................14
Forward-Looking and
Cautionary Statements .....................................15
Management Discussion Snapshot ..................16
Description of Business ....................................17
Year in Review ..................................................23
Prior Year in Review ........................................37
Discontinued Operations .................................42
Other Information ............................................42
Global Financing ........................................ 50
Report of Management ....................................56
Report of Independent Registered
Public Accounting Firm ...................................57
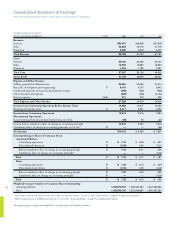
Consolidated Statements ..................................58
Notes .................................................................64