IBM 2007 Annual Report Download - page 42
Download and view the complete annual report
Please find page 42 of the 2007 IBM annual report below. You can navigate through the pages in the report by either clicking on the pages listed below, or by using the keyword search tool below to find specific information within the annual report.-
 1
1 -
2
-
3
-
4
-
5
-
6
-
7
-
8
-
9
-
10
-
11
-
12
-
13
-
14
-
15
-
16
-
17
-
18
-
19
-
20
-
21
-
22
-
23
-
24
-
25
-
26
-
27
-
28
-
29
-
30
-
31
-
 32
32 -
 33
33 -
 34
34 -
 35
35 -
 36
36 -
 37
37 -
 38
38 -
 39
39 -
 40
40 -
 41
41 -
 42
42 -
 43
43 -
 44
44 -
 45
45 -
 46
46 -
 47
47 -
 48
48 -
 49
49 -
 50
50 -
 51
51 -
 52
52 -
53
-
54
-
55
-
56
-
57
-
58
-
59
-
60
-
61
-
62
-
63
-
64
-
65
-
66
-
67
-
68
-
69
-
70
-
71
-
72
-
73
-
74
-
75
-
76
-
77
-
78
-
79
-
80
-
81
-
82
-
83
-
84
-
85
-
86
-
87
-
88
-
89
-
90
-
91
-
92
-
93
-
94
-
95
-
96
-
97
-
98
-
99
-
100
-
101
-
102
-
103
-
104
-
105
-
106
-
107
-
108
-
109
-
110
-
111
-
112
-
113
-
114
-
115
-
116
-
117
-
118
-
119
-
120
-
121
-
122
-
123
-
124
-
125
-
126
-
127
-
128
 |
 |

Management Discussion
International Business Machines Corporation and Subsidiary Companies
40
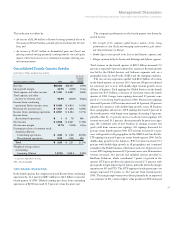
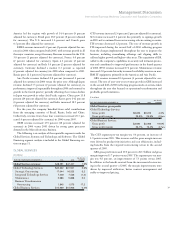
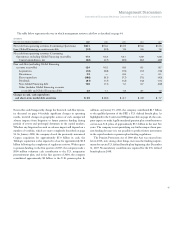
SYSTEMS AND TECHNOLOGY
($ in millions)
YR.-TO-YR.
FOR THE YEAR ENDED DECEMBER 31: 2006 2005 CHANGE
Systems and Technology revenue: $21,970 $20,981 4.7%
System z 7.8%
System i (15.0)
System p (1.1)
System x 3.7
System Storage 6.4
Microelectronics 21.9
Engineering & Technology Services (16.2)
Retail Store Solutions 21.4
Printing Systems (7.6)
Systems and Technology revenue increased 4.7 percent (4 percent
adjusted for currency) in 2006 versus 2005. System z revenue increased
7.8 percent reflecting continued strong customer acceptance of both
specialty engines for Linux and Java workloads and traditional main-
frame workloads. MIPS shipments increased 11 percent versus 2005.
System x revenue increased 3.7 percent driven by increased server
revenue (5.3 percent) and System x blades growth of 22.3 percent.
Although System p revenue declined 1.1 percent for the year, high-
end server revenue increased 9.4 percent. In the third quarter of
2006, the company completed its transition to POWER5+ and
expanded the implementation of POWER Quadcore technology to
all POWER-based entry level System p products. System i revenue
declined 15.0 percent as the company completed its transition to
POWER5+ in the third quarter of 2006, however clients continued
to leverage their existing capacity.
Systems Storage revenue increased 6.4 percent and was driven by
Total disk growth of 7.8 percent, while tape grew 3.1 percent. Within
Total disk, mid-range disk revenue increased 16.5 percent and stor-
age area network products increased 10.6 percent, while enterprise
products revenue declined 6.7 percent. The revenue increase in tape
products was primarily driven by the new tape security offering
which includes unique encryption capabilities.
Microelectronics revenue increased 21.9 percent due to strong
demand in the game processor business and networking components.
Retail Store Solutions revenue increased 21.4 percent primarily
due to clients replacing older technology in favor of integrated retail
solutions. Printing Systems revenue decreased 7.6 percent due pri-
marily to lower maintenance revenue as a result of a declining install
base and lower sales of hardware products.
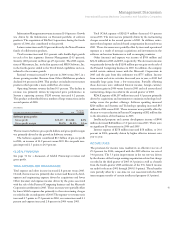
($ in millions)
YR.-TO-YR.
FOR THE YEAR ENDED DECEMBER 31: 2006 2005 CHANGE
Systems and Technology gross profit:
Gross profit $8,284 $8,473 (2.2)%
Gross profit margin 37.7% 40.4% (2.7) pts.
Systems and Technology gross profit margin declined 2.7 points to
37.7 percent in 2006 versus 2005. The decline in gross profit margin
was driven by revenue mix towards lower margin products in 2006
versus 2005 (2.5 points) and pricing pressure in the low- and middle-
range server brands. Segment pre-tax margin was 7.5 percent, down
1.0 point versus the prior year.
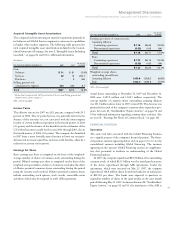
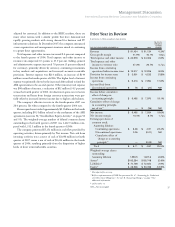
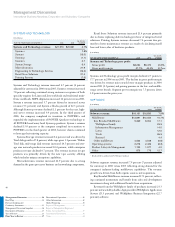
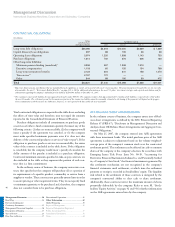
SOFTWARE
($ in millions)
YR.-TO-YR.
FOR THE YEAR ENDED DECEMBER 31: 2006 2005* CHANGE
Software revenue: $18,161 $16,830 7.9%
Middleware $13,891 $12,552 10.7%
Key Branded Middleware 9,369 8,004 17.1
WebSphere Family 23.3
Information Management 14.0
Lotus 12.0
Tivoli 26.3
Rational 4.4
Other middleware 4,522 4,548 (0.6)
Operating systems 2,273 2,426 (6.3)
Product Lifecycle Management 1,123 1,077 4.2
Other 873 775 12.7
* Reclassified to conform with 2006 presentation.
Software segment revenue increased 7.9 percent (7 percent adjusted
for currency) in 2006 versus 2005 reflecting strong demand for the
company’s industry-leading middleware capabilities. The revenue
growth was driven from both organic sources and acquisitions.
Key Branded Middleware revenue increased 17.1 percent, reflect-
ing continued momentum and benefit from sales and development
investments along with additional benefit from acquisitions.
Revenue from the WebSphere family of products increased 23.3
percent and was led by double-digit growth in WebSphere Application
Servers (25.3 percent) and WebSphere Business Integration (22.7
percent) software.
Management Discussion ............................ 14
Road Map .........................................................14
Forward-Looking and
Cautionary Statements .....................................15
Management Discussion Snapshot ..................16
Description of Business ....................................17
Year in Review ..................................................23
Prior Year in Review .................................. 37
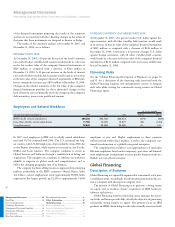
Discontinued Operations .................................42
Other Information ............................................42
Global Financing ..............................................50
Report of Management ....................................56
Report of Independent Registered
Public Accounting Firm ...................................57
Consolidated Statements ..................................58
Notes .................................................................64