IBM 2007 Annual Report Download - page 6
Download and view the complete annual report
Please find page 6 of the 2007 IBM annual report below. You can navigate through the pages in the report by either clicking on the pages listed below, or by using the keyword search tool below to find specific information within the annual report.-
 1
1 -
 2
2 -
 3
3 -
 4
4 -
 5
5 -
 6
6 -
 7
7 -
 8
8 -
 9
9 -
 10
10 -
 11
11 -
 12
12 -
 13
13 -
 14
14 -
 15
15 -
 16
16 -
 17
17 -
18
-
19
-
20
-
21
-
22
-
23
-
24
-
25
-
26
-
27
-
28
-
29
-
30
-
31
-
32
-
33
-
34
-
35
-
36
-
37
-
38
-
39
-
40
-
41
-
42
-
43
-
44
-
45
-
46
-
47
-
48
-
49
-
50
-
51
-
52
-
53
-
54
-
55
-
56
-
57
-
58
-
59
-
60
-
61
-
62
-
63
-
64
-
65
-
66
-
67
-
68
-
69
-
70
-
71
-
72
-
73
-
74
-
75
-
76
-
77
-
78
-
79
-
80
-
81
-
82
-
83
-
84
-
85
-
86
-
87
-
88
-
89
-
90
-
91
-
92
-
93
-
94
-
95
-
96
-
97
-
98
-
99
-
100
-
101
-
102
-
103
-
104
-
105
-
106
-
107
-
108
-
109
-
110
-
111
-
112
-
113
-
114
-
115
-
116
-
117
-
118
-
119
-
120
-
121
-
122
-
123
-
124
-
125
-
126
-
127
-
128
 |
 |
4
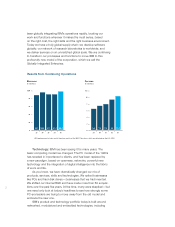
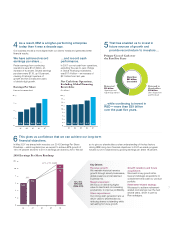
income margin compares very favorably to our technology peers and
to the companies of the Dow 30. We have reversed the margin
decline of the late 1990s, and we have a stronger business model
today, with less volatility and more high-profit revenue opportunity.
Earnings per share: We have continued to achieve strong
EPS growth. Last year was another record, with diluted earnings per
share from continuing operations of $7.18, up 18 percent. This marked
20 straight quarters of EPS growth.
Cash flow: IBM has consistently generated strong cash flow.
In 2007 our net cash from operations, excluding the year-to-year
change in Global Financing receivables, was $17.4 billion
—
an increase
of $2.1 billion from last year. Our business model has allowed us to
generate more than $70 billion in cash flow over the past five years.
IBM ended 2007 with $16.1 billion of cash and marketable securities.
Investment and return to shareholders: Our superior cash
flow has enabled us to invest in the business
—
through strategic
acquisitions and capital expenditures to drive growth
—
and to
generate substantial returns to investors through increased dividends
and significant share repurchase. Our 2007 cash investment was
$1 billion for 12 acquisitions
—
six of them in key areas of software.
And after investing $6.2 billion in R&D and $5 billion in net capital
expenditures, we were able to return a record of nearly $21 billion
to you
—
$18.8 billion through share repurchase and $2.1 billion
through dividends
—
or more than 100 percent of our net earnings.
This year’s dividend increase was 33 percent, marking the 12th year
in a row in which we have raised our dividend. In the last two years,
IBM has doubled its quarterly dividend.
Our balance sheet remains strong, and the company is well
positioned to take advantage of new strategic opportunities.
The results of IBM’s strategic choices and actions over the last
several years have been better client focus, clearer marketplace
differentiation and a stronger financial engine. We have also achieved
superior flexibility
—
a competitive advantage in uncertain economic
times. This strengthened business model and our excellent
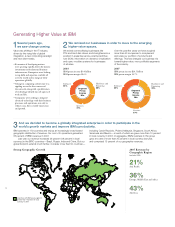
performance in 2007 have increased our confidence that we will
meet our 2010 objective of $10 to $11 in earnings per share. I think
the information on pages 6 to 7 will help you understand the sources
of that confidence.
We have entered 2008 with strong momentum
—
but can we
sustain it? This is a legitimate question, especially given the
current economic indicators in the United States and other parts of
the developed world. A number of companies aren’t sounding
The IBM
Difference
Our balance sheet remains strong, and the company is well positioned
to take advantage of new strategic opportunities.