IBM 2007 Annual Report Download - page 28
Download and view the complete annual report
Please find page 28 of the 2007 IBM annual report below. You can navigate through the pages in the report by either clicking on the pages listed below, or by using the keyword search tool below to find specific information within the annual report.-
 1
1 -
2
-
3
-
4
-
5
-
6
-
7
-
8
-
9
-
10
-
11
-
12
-
13
-
14
-
15
-
16
-
17
-
 18
18 -
 19
19 -
 20
20 -
 21
21 -
 22
22 -
 23
23 -
 24
24 -
 25
25 -
 26
26 -
 27
27 -
 28
28 -
 29
29 -
 30
30 -
 31
31 -
 32
32 -
 33
33 -
 34
34 -
 35
35 -
 36
36 -
 37
37 -
 38
38 -
39
-
40
-
41
-
42
-
43
-
44
-
45
-
46
-
47
-
48
-
49
-
50
-
51
-
52
-
53
-
54
-
55
-
56
-
57
-
58
-
59
-
60
-
61
-
62
-
63
-
64
-
65
-
66
-
67
-
68
-
69
-
70
-
71
-
72
-
73
-
74
-
75
-
76
-
77
-
78
-
79
-
80
-
81
-
82
-
83
-
84
-
85
-
86
-
87
-
88
-
89
-
90
-
91
-
92
-
93
-
94
-
95
-
96
-
97
-
98
-
99
-
100
-
101
-
102
-
103
-
104
-
105
-
106
-
107
-
108
-
109
-
110
-
111
-
112
-
113
-
114
-
115
-
116
-
117
-
118
-
119
-
120
-
121
-
122
-
123
-
124
-
125
-
126
-
127
-
128
 |
 |

Management Discussion
International Business Machines Corporation and Subsidiary Companies
26
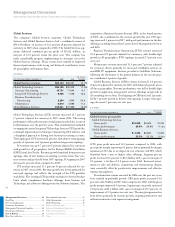
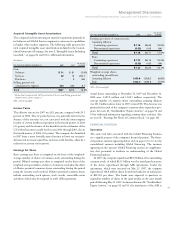
System z revenue decreased 11.2 percent (15 percent adjusted for
currency) year to year. System z MIPS (millions of instructions per
second) shipments increased 3 percent in 2007 versus 2006. System z
revenue declined in the second half of 2007 following a long and
successful technology cycle of over two-and-a-half years. The expected
announcement and availability of the next generation mainframe is
late February 2008.
System i revenue decreased 10.6 percent (14 percent adjusted for
currency) in 2007 versus 2006. Although System i revenue declined
year over year, fourth-quarter 2007 revenue increased 2 percent with
growth in POWER6 servers which were introduced late in the third
quarter of 2007.
System p revenue increased 8.8 percent (5 percent adjusted for
currency) in 2007 versus 2006. The increase was primarily driven by
strength in mid-range POWER5+ and POWER6 servers, which
increased 23 percent in 2007 versus the prior year. System p revenue
increased in all geographies, with particular strength in Asia Pacific.
In the first quarter of 2008, the company will announce and ship
POWER6 technology in System p’s entry segment.
System x revenue increased 7.0 percent (3 percent adjusted for
currency) in 2007 versus 2006. Revenue performance was driven by
System x server products which grew 8 percent and System x blades
which increased 16 percent in 2007 versus 2006. The new x86 servers
with quad-core processors and BladeCenter-S for the Small and
Medium Business sector shipped in the fourth quarter and were well
received in the marketplace.
System Storage revenue increased 5.1 percent (2 percent adjusted
for currency) in 2007 versus 2006. The increase was primarily driven
by 13 percent growth in tape products, while external disk products
increased 1 percent in 2007. Enterprise tape products had strong
double-digit revenue growth, while Midrange tape products had mid
single-digit revenue growth. The company completed the acquisition
of XIV in late December, which will further strengthen its storage
portfolio in the long term. This acquisition positions the company to
grow in emerging opportunities like Web 2.0 applications, digital
archives and digital media.
Microelectronics revenue decreased 11.8 percent in 2007 versus
2006, driven by reduced demand for game processors. The Micro-
electronics OEM business has minimal impact to the company’s
overall Net income, but this business continues to deliver key tech-
nology to the systems business, which is the fundamental objective of
the company’s investment.
Retail Store Solutions revenue increased 14.5 percent (11 percent
adjusted for currency) in 2007 versus 2006, primarily due to the
continued roll out of new programmable point-of-sale solutions to
large retail clients.
Printing Systems revenue decreased as a result of the divestiture
of the business. The 2007 results include five months of revenue
while the 2006 results include 12 months of revenue.
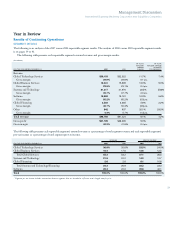
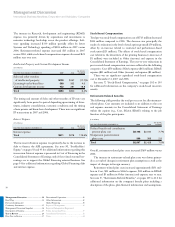
($ in millions)
YR.-TO-YR.
FOR THE YEAR ENDED DECEMBER 31: 2007 2006 CHANGE
Systems and Technology gross profit:
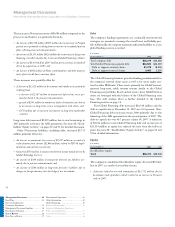
Gross profit $8,468 $8,284 2.2%
Gross profit margin 39.7% 37.7% 2.0 pts.
The increase in Systems and Technology gross profit dollars for 2007
versus 2006 was primarily due to higher gross profit margins in System
z, System p and System x servers. The Systems and Technology gross
profit margin increased 2.0 points to 39.7 percent in 2007. System p
performance contributed 1.3 points to the overall margin improve-
ment, while System z and System x contributed 0.7 points and 0.4
points, respectively. These increases were partially offset by lower gross
margins in System i of 0.2 points and System Storage 0.2 points.
Systems and Technology pre-tax margin expanded 2.1 points to
9.6 percent in 2007, reflecting a strong combination of operational
cost management and the value that virtualization is driving in the
enterprise space.
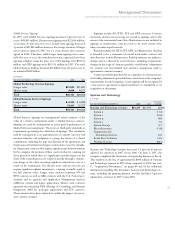
Software
($ in millions)
YR.-TO-YR.
FOR THE YEAR ENDED DECEMBER 31: 2007 2006* CHANGE
Software revenue: $19,982 $18,161 10.0%
Middleware $15,505 $13,891 11.6%
Key Branded Middleware 10,827 9,373 15.5
WebSphere Family 19.1
Information Management 14.7
Lotus 8.7
Tivoli 18.0
Rational 13.7
Other middleware 4,678 4,518 3.5
Operating Systems 2,319 2,273 2.0
Product Lifecycle
Management 1,051 1,123 (6.4)
Other 1,107 874 26.7
* Reclassified to conform with 2007 presentation.
Management Discussion ............................ 14
Road Map .........................................................14
Forward-Looking and
Cautionary Statements .....................................15
Management Discussion Snapshot ..................16
Description of Business ....................................17
Year in Review ............................................ 23
Prior Year in Review ........................................37
Discontinued Operations .................................42
Other Information ............................................42
Global Financing ..............................................50
Report of Management ....................................56
Report of Independent Registered
Public Accounting Firm ...................................57
Consolidated Statements ..................................58
Notes .................................................................64