IBM 2007 Annual Report Download - page 41
Download and view the complete annual report
Please find page 41 of the 2007 IBM annual report below. You can navigate through the pages in the report by either clicking on the pages listed below, or by using the keyword search tool below to find specific information within the annual report.-
 1
1 -
2
-
3
-
4
-
5
-
6
-
7
-
8
-
9
-
10
-
11
-
12
-
13
-
14
-
15
-
16
-
17
-
18
-
19
-
20
-
21
-
22
-
23
-
24
-
25
-
26
-
27
-
28
-
29
-
30
-
 31
31 -
 32
32 -
 33
33 -
 34
34 -
 35
35 -
 36
36 -
 37
37 -
 38
38 -
 39
39 -
 40
40 -
 41
41 -
 42
42 -
 43
43 -
 44
44 -
 45
45 -
 46
46 -
 47
47 -
 48
48 -
 49
49 -
 50
50 -
 51
51 -
52
-
53
-
54
-
55
-
56
-
57
-
58
-
59
-
60
-
61
-
62
-
63
-
64
-
65
-
66
-
67
-
68
-
69
-
70
-
71
-
72
-
73
-
74
-
75
-
76
-
77
-
78
-
79
-
80
-
81
-
82
-
83
-
84
-
85
-
86
-
87
-
88
-
89
-
90
-
91
-
92
-
93
-
94
-
95
-
96
-
97
-
98
-
99
-
100
-
101
-
102
-
103
-
104
-
105
-
106
-
107
-
108
-
109
-
110
-
111
-
112
-
113
-
114
-
115
-
116
-
117
-
118
-
119
-
120
-
121
-
122
-
123
-
124
-
125
-
126
-
127
-
128
 |
 |

Management Discussion
International Business Machines Corporation and Subsidiary Companies
39
America led the regions with growth of 14.4 percent (9 percent
adjusted for currency). Brazil grew 18.9 percent (8 percent adjusted
for currency). The U.S. increased 3.6 percent and Canada grew
6.5 percent (flat adjusted for currency).
EMEA revenue increased 3.2 percent (2 percent adjusted for cur-
rency) in 2006 when compared with 2005, with revenue growth in all
the major countries, except Germany. Revenue increased in the U.K.
3.0 percent (1 percent adjusted for currency), France 4.0 percent
(2 percent adjusted for currency), Spain 4.1 percent (2 percent
adjusted for currency) and Italy 3.6 percent (2 percent adjusted for
currency). Germany declined a modest 0.3 percent as reported
(2 percent adjusted for currency) in 2006 when compared to 2005.
Russia grew 21.1 percent (21 percent adjusted for currency).
Asia Pacific revenue declined 0.8 percent (increased 2 percent
adjusted for currency) in 2006 versus the prior year. Although Japan
revenue declined 7.5 percent (2 percent adjusted for currency), its
performance improved sequentially throughout 2006 and returned to
growth in the fourth quarter; partially offsetting the revenue decline
in Japan was growth in other Asia Pacific regions. China grew 15.8
percent (14 percent adjusted for currency), Korea grew 14.2 percent
(6 percent adjusted for currency) and India increased 38.5 percent
(42 percent adjusted for currency).
For the year, the company benefited from solid contributions
from the emerging countries of Brazil, Russia, India and China.
Collectively, revenue from these four countries increased 20.5 per-
cent (16 percent adjusted for currency) in 2006 versus 2005.
OEM revenue increased 17.9 percent (18 percent adjusted for
currency) in 2006 versus 2005 driven by strong game processor
demand in the Microelectronics business.
The following is an analysis of the reportable segment results for
Global Services, Systems and Technology and Software. The Global
Financing segment analysis is included in the Global Financing sec-
tion on page 51.
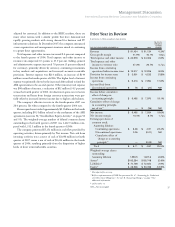
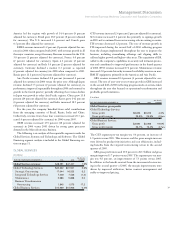
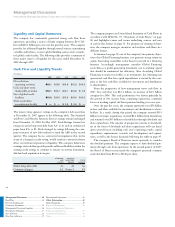
GLOBAL SERVICES
($ in millions)
YR.-TO-YR.
FOR THE YEAR ENDED DECEMBER 31: 2006 2005 CHANGE
Global Services revenue: $48,291 $47,407 1.9%
Global Technology Services $32,322 $31,501 2.6%
Strategic Outsourcing 17,044 16,522 3.2
Integrated Technology Services 7,448 7,538 (1.2)
Maintenance 5,986 5,868 2.0
Business Transformation
Outsourcing 1,845 1,573 17.2
Global Business Services $15,969 $15,906 0.4%
GTS revenue increased 2.6 percent (2 percent adjusted for currency).
SO revenue increased 3.2 percent due primarily to signings growth
in 2005 and a continued focus on increasing sales in existing accounts.
ITS revenue decreased 1.2 percent. The rate of revenue growth in
ITS improved during the second half of 2006 reflecting progress
from the changes implemented throughout the year to improve the
business, including streamlining offerings and aligning skills to
address higher growth and higher value areas. The acquisition of ISS,
added to the company’s capabilities in security and intrusion protec-
tion and contributed to improved performance in the fourth quarter
of 2006. BTO revenue increased 17.2 percent. Maintenance revenue
increased 2.0 percent driven by increased availability services on non-
IBM IT equipment, primarily in the Americas and Asia Pacific.
GBS revenue increased 0.4 percent (1 percent adjusted for cur-
rency). The rate of year-over-year revenue growth in GBS increased
in the second half of 2006 reflecting progress made on actions taken
throughout the year that focused on operational transformation and
profitable growth initiatives.
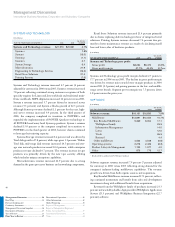
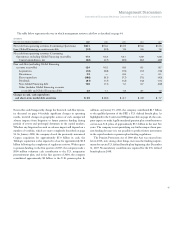
($ in millions)
YR.-TO-YR.
FOR THE YEAR ENDED DECEMBER 31: 2006 2005 CHANGE
Global Services gross profit:
Global Technology Services:
Gross profit $9,623 $9,226 4.3%
Gross profit margin 29.8% 29.3% 0.5 pts.
Global Business Services:
Gross profit $3,694 $3,088 19.6%
Gross profit margin 23.1% 19.4% 3.7 pts.
The GTS segment pre-tax margin was 9.6 percent, an increase of
1.9 points versus 2005. This increase and the gross margin increase
were driven by productivity initiatives and cost efficiencies, includ-
ing benefits from the targeted restructuring action in the second
quarter of 2005.
GBS gross profit increased 19.6 percent to $3.7 billion and gross
margin improved 3.7 points versus 2005. The segment pre-tax mar-
gin was 9.8 percent, an improvement of 5.3 points versus 2005.
In addition to the benefit received from the incremental restructur-
ing in the second quarter of 2005, the margin improvements were
driven by improved utilization, better contract management and
stable-to-improved pricing.