IBM 2007 Annual Report Download - page 46
Download and view the complete annual report
Please find page 46 of the 2007 IBM annual report below. You can navigate through the pages in the report by either clicking on the pages listed below, or by using the keyword search tool below to find specific information within the annual report.-
 1
1 -
2
-
3
-
4
-
5
-
6
-
7
-
8
-
9
-
10
-
11
-
12
-
13
-
14
-
15
-
16
-
17
-
18
-
19
-
20
-
21
-
22
-
23
-
24
-
25
-
26
-
27
-
28
-
29
-
30
-
31
-
32
-
33
-
34
-
35
-
 36
36 -
 37
37 -
 38
38 -
 39
39 -
 40
40 -
 41
41 -
 42
42 -
 43
43 -
 44
44 -
 45
45 -
 46
46 -
 47
47 -
 48
48 -
 49
49 -
 50
50 -
 51
51 -
 52
52 -
 53
53 -
 54
54 -
 55
55 -
 56
56 -
57
-
58
-
59
-
60
-
61
-
62
-
63
-
64
-
65
-
66
-
67
-
68
-
69
-
70
-
71
-
72
-
73
-
74
-
75
-
76
-
77
-
78
-
79
-
80
-
81
-
82
-
83
-
84
-
85
-
86
-
87
-
88
-
89
-
90
-
91
-
92
-
93
-
94
-
95
-
96
-
97
-
98
-
99
-
100
-
101
-
102
-
103
-
104
-
105
-
106
-
107
-
108
-
109
-
110
-
111
-
112
-
113
-
114
-
115
-
116
-
117
-
118
-
119
-
120
-
121
-
122
-
123
-
124
-
125
-
126
-
127
-
128
 |
 |

Management Discussion
International Business Machines Corporation and Subsidiary Companies
44
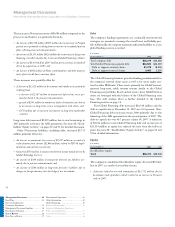
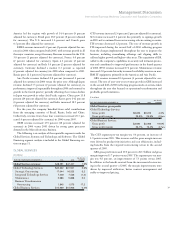
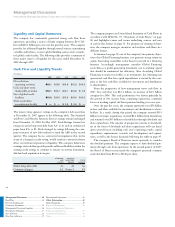
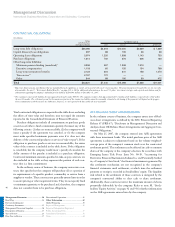
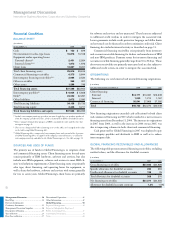
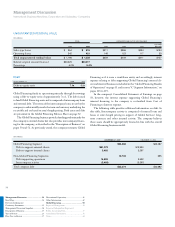
Liquidity and Capital Resources
The company has consistently generated strong cash flow from
operations, providing a source of funds ranging between $14.5 bil-
lion and $16.1 billion per year over the past five years. The company
provides for additional liquidity through several sources; maintaining
a sizable cash balance, access to global funding sources and a commit-
ted global credit facility. The following table provides a summary of
these major sources of liquidity for the years ended December 31,
2003 through 2007.
Cash Flow and Liquidity Trends
($ in billions)
2007 2006 2005 2004 2003
Net cash from
operating activities $16.1 $15.0 $14.9 $15.3 $14.5
Cash and short-term
marketable securities $16.1 $10.7 $13.7 $10.6 $ 7.6
Size of global credit
facilities $10.0 $10.0 $10.0 $10.0 $10.0
Trade receivables
securitization facility $ — $ — $ 0.5 $ 0.5 $ —
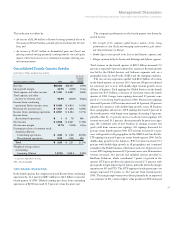
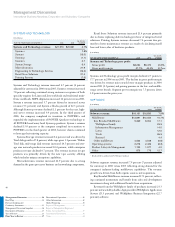
The major rating agencies’ ratings on the company’s debt securities
at December 31, 2007 appear in the following table. The Standard
and Poor’s and Moody’s Investors Services ratings remain unchanged
from December 31, 2006. In May 2007, Fitch Ratings lowered its
ratings on senior long-term debt from AA- to A+ and on commercial
paper from F1+ to F1. Fitch changed its ratings following the com-
pany’s issuance of new debt utilized to fund the ASR in the second
quarter. The company has no contractual arrangements that, in the
event of a change in credit rating, would result in a material adverse
effect on its financial position or liquidity. The company believes its
earnings and cash flow growth provide sufficient flexibility within the
existing credit ratings to continue to execute its current investment,
dividend and acquisition strategies.
STANDARD MOODY’S
AND INVESTORS FITCH
POOR’S SERVICE RATINGS
Senior long-term debt A+ A1 A+
Commercial paper A-1 Prime-1 F1
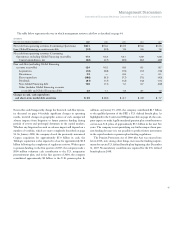
The company prepares its Consolidated Statement of Cash Flows in
accordance with SFAS No. 95, “Statement of Cash Flows,” on page
60 and highlights causes and events underlying sources and uses
of cash in that format on page 33. For purposes of running its busi-
ness, the company manages, monitors and analyzes cash flows in a
different format.
As discussed on page 50, one of the company’s two primary objec-
tives of its Global Financing business is to generate strong return on
equity. Increasing receivables is the basis for growth in a financing
business. Accordingly, management considers Global Financing
receivables as a profit-generating investment, not as working capital
that should be minimized for efficiency. After classifying Global
Financing accounts receivables as an investment, the remaining net
operational cash flow less capital expenditures is viewed by the com-
pany as the free cash flow available for investment and distribution
to shareholders.
From the perspective of how management views cash flow, in
2007, free cash flow was $12.4 billion, an increase of $1.9 billion
compared to 2006. This cash performance was driven primarily by
the growth in Net income from continuing operations, continued
focus on working capital and lower pension funding year over year.
Over the past five years, the company generated over $50 billion
in free cash flow available for investment and distribution to share-
holders. As a result, during that period the company invested $9.9
billion in strategic acquisitions, received $1.4 billion from divestitures
and returned over $53 billion to shareholders through dividends and
share repurchases. The amount of prospective returns to sharehold-
ers in the form of dividends and share repurchases will vary based
upon several factors including each year’s operating results, capital
expenditure requirements, research and development and acquisi-
tions, as well as the factors discussed following the table on page 45.
The company’s Board of Directors meets quarterly to consider
the dividend payment. The company expects to fund dividend pay-
ments through cash from operations. In the second quarter of 2007,
the Board of Directors increased the company’s quarterly common
stock dividend from $0.30 to $0.40 per share.
Management Discussion ............................ 14
Road Map .........................................................14
Forward-Looking and
Cautionary Statements .....................................15
Management Discussion Snapshot ..................16
Description of Business ....................................17
Year in Review ..................................................23
Prior Year in Review ........................................37
Discontinued Operations .................................42
Other Information...................................... 42
Global Financing ..............................................50
Report of Management ....................................56
Report of Independent Registered
Public Accounting Firm ...................................57
Consolidated Statements ..................................58
Notes .................................................................64