IBM 2007 Annual Report Download - page 53
Download and view the complete annual report
Please find page 53 of the 2007 IBM annual report below. You can navigate through the pages in the report by either clicking on the pages listed below, or by using the keyword search tool below to find specific information within the annual report.-
 1
1 -
2
-
3
-
4
-
5
-
6
-
7
-
8
-
9
-
10
-
11
-
12
-
13
-
14
-
15
-
16
-
17
-
18
-
19
-
20
-
21
-
22
-
23
-
24
-
25
-
26
-
27
-
28
-
29
-
30
-
31
-
32
-
33
-
34
-
35
-
36
-
37
-
38
-
39
-
40
-
41
-
42
-
 43
43 -
 44
44 -
 45
45 -
 46
46 -
 47
47 -
 48
48 -
 49
49 -
 50
50 -
 51
51 -
 52
52 -
 53
53 -
 54
54 -
 55
55 -
 56
56 -
 57
57 -
 58
58 -
 59
59 -
 60
60 -
 61
61 -
 62
62 -
 63
63 -
64
-
65
-
66
-
67
-
68
-
69
-
70
-
71
-
72
-
73
-
74
-
75
-
76
-
77
-
78
-
79
-
80
-
81
-
82
-
83
-
84
-
85
-
86
-
87
-
88
-
89
-
90
-
91
-
92
-
93
-
94
-
95
-
96
-
97
-
98
-
99
-
100
-
101
-
102
-
103
-
104
-
105
-
106
-
107
-
108
-
109
-
110
-
111
-
112
-
113
-
114
-
115
-
116
-
117
-
118
-
119
-
120
-
121
-
122
-
123
-
124
-
125
-
126
-
127
-
128
 |
 |

Management Discussion
International Business Machines Corporation and Subsidiary Companies
51
a financing company. Global Financing has the benefit of both a deep
knowledge of its client base and a clear insight into the products that
are being leased. This combination allows Global Financing to effec-
tively manage two of the major risks (credit and residual value) that
are normally associated with financing.
Global Financing comprises three lines of business:
U Client financing provides lease and loan financing to end users and inter-
nal clients for terms generally between two and seven years. Internal
financing is predominantly in support of Global Services’ long-term client
service contracts. Global Financing also factors a selected portion of the
company’s accounts receivable, primarily for cash management purposes.
All internal financing arrangements are at arm’s-length rates and are
based upon market conditions.
U Commercial financing provides primarily short-term inventory and
accounts receivable financing to dealers and remarketers of IT products.
U Remarketing sells and leases used equipment to new or existing clients both
externally and internally. This equipment is primarily sourced from the
conclusion of lease transactions. Externally-remarketed equipment reve-
nue represents sales or leases to clients and resellers. Internally-remarketed
equipment revenue primarily represents used equipment that is sold or
leased internally to the System and Technology and Global Services seg-
ments. The System and Technology segment may also sell the equipment
that it purchases from Global Financing to external clients.
In addition to the strength of the economy and its impact on corporate
IT budgets, key drivers of Global Financing’s results are interest
rates and originations. Interest rates directly impact Global Financ-
ing’s business by increasing or decreasing both financing revenue and
the associated borrowing costs. Originations, which determine the
asset base of Global Financing’s annuity-like business, are impacted
by IBM’s non-Global Financing sales volumes and Global Financing’s
participation rates. Participation rates are the propensity of IBM’s
clients to finance their purchases through Global Financing in lieu of
paying IBM up-front cash or financing through a third party.
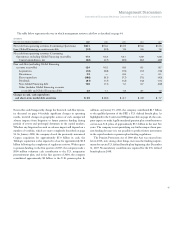
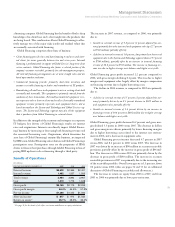
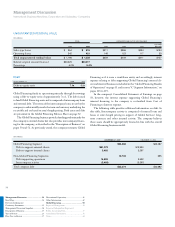
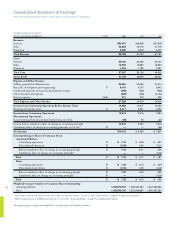
Results of Operations
($ in millions)
FOR THE YEAR ENDED DECEMBER 31: 2007 2006 2005
External revenue $2,502 $2,365 $2,401
Internal revenue 1,482 1,527 1,506
Total revenue 3,984 3,892 3,907
Cost 1,819 1,773 1,648
Gross profit $2,165 $2,119 $2,259
Gross profit margin 54.4% 54.5% 57.8%
Pre-tax income $1,386 $1,455 $1,583
After-tax income* $ 877 $ 914 $1,032
Return on equity * 26.1% 29.5% 33.2%
* See page 55 for the details of the After-tax income and Return on equity calculations.
The increase in 2007 revenue, as compared to 2006, was primarily
due to:
U Growth in external revenue of 5.8 percent (2 percent adjusted for cur-
rency) primarily driven by increased used equipment sales (up 12.7 percent
to $704 million); partially offset by
U A decline in internal revenue of 3.0 percent, due primarily to lower used
equipment sales to the Systems and Technology segment (down 15.7 percent
to $780 million), partially offset by an increase in internal financing
revenue of 16.6 percent to $702 million. The increase in financing rev-
enue was due to higher average asset balances and higher asset yields.
Global Financing gross profit increased 2.2 percent compared to
2006, with gross margin declining 0.1 point. This was due to higher
margin used equipment sales largely offset by margin compression
on financing revenue due to higher borrowing costs.
The decline in 2006 revenue, as compared to 2005 was primarily
due to:
U A decline in external revenue of 1.5 percent (2 percent adjusted for cur-
rency) primarily driven by an 8.3 percent decrease to $625 million in
used equipment sales; partially offset by
U Growth in internal revenue of 1.4 percent driven by an increase in
financing revenue of 10.6 percent to $602 million due to higher average
asset balances and higher asset yields.
Global Financing gross profit decreased 6.2 percent and gross mar-
gin declined 3.3 points in 2006 versus 2005. The decrease in dollars
and gross margin was driven primarily by lower financing margins
due to higher borrowing costs related to the interest rate environ-
ment in 2006, and a decrease in equipment sales.
Global Financing pre-tax income decreased 4.7 percent in 2007
versus 2006, and 8.1 percent in 2006 versus 2005. The decrease in
2007 was driven by an increase of $90 million in accounts receivable
provisions, partially offset by the increase in gross profit of $46 mil-
lion. The decrease in 2006 versus 2005 was primarily driven by the
decrease in gross profit of $140 million. The increase in accounts
receivable provisions in 2007 was primarily due to the increasing size
of the receivables portfolio. Overall coverage rate is 1.3 percent, down
0.2 points versus 2006. (Also see pages 52 and 53 for an additional
discussion of Global Financing receivables and allowances.)
The decrease in return on equity from 2006 to 2007, and from
2005 to 2006 was primarily due to lower pre-tax income.